
Shared Dimension – Inventory Analysis
Have you loaded data into a new workbook lately? You probably noticed something different on the Data Source tab. Data can be in Base tables or Related tables, and you can relate data across shared dimensions. I wanted to see how it’s used in doing an inventory analysis. Preparing an inventory analysis has been difficult, […]
Viz Extensions – How to get started
So, you are new to Tableau and heard about Viz Extension. Maybe think – Aren’t those for more advanced users? NO – they were developed to make it easier to use advanced charts, graphs, and tables in your Viz. Got your attention? Then read on- Viz extensions are single-purpose “functions” developed by Tableau and contributing […]
Custom Formatting
We often get questions on how to do conditional format (like the spreadsheets do) – First, Tableau is not a Spreadsheet – see Link BGS 1 if you need confirmation) – In Tableau there is a data table for each worksheet. It is created by dragging dimensions to the rows and columns of shelves. The […]
Filter, Set and Parameter Actions –
Actions – you use them but do you know what they really do? The most frequently used ones simply change a value – that’s right – Granted some will take you places – like “Go to Sheet” or “Go to URL” – and you can highlight – But Filter, Set, and Parameter Actions just change […]
Reference Lines and More
Comparing measures, viewing distributions and identifying outliers can all be done using reference lines! Easy to use and make your dashboards more user-friendly. But lets's start with the basics: See the video at Link to RL video 1 The Analytics Tab: Basic and Custom Reference Line functions can be found on the Analytics tab […]
Tableau Basic Mapping Techniques
Tableau – Basic Mapping Techniques Guest Author Don Wise – Tableau Community Forums Ambassador I think mapping in Tableau is one of the best features of the product. In fact, it’s one of the core reasons my organization selected Tableau over the several available BI products on the market in 2013. I started with Version 7 in […]
Order of Operation and Calculations
The Order of Operation is the single most important concept you need to understand during your journey to learn Tableau. So what is the Order of Operation in the first place? Simply stated it is the sequence Tableau follows each time you create a new worksheet. I like to use the 10-step model […]
Tableau Data Literacy and Analytic Program-High School Level
Understanding and working with data is an essential skill today – you knew that! So, what can we do to prepare our middle and high-school-age children for careers in data? How would you start- Over the past 2 years, we have been conducting a pilot program to identify what was needed, and how that fits […]
Grand Total and Sub-Total – Use Cases
Recently, we've seen many questions on the Forums on Grand Totals and Sub-Totals – how they are calculated, when to use them or another approach to get totals, how to sub-total some – but not all of the measures – what to do when they return an unexpected result. See the video at Link to GT […]
Use Cases – Occupancy, Turnover, Lost Customer and Schedule Availability Analysis
Occupancy and Turnover Rates and Lost customers We see a lot of questions on the Forums on calculating occupancy and turnover rates or scheduling meeting rooms and identifying lost customers. They may sound like different problems but the solutions are very similar and require joining base data with a date scaffold or to a copy […]
Dynamic Zone Visibility – Use Cases
With the introduction of Dynamic Zone Visibility in version 2022.3, sheet swapping, changing date levels in views, and hiding or showing controls or legends just became much easier to set up and use. So how do you set up DZV and where can they be used? See the video at Link to DZV Dynamic […]
If's, And's, Cases and In's Logical Operator's – How to's
Logical functions like If/Then , Cases, And/Or or In statements are a fundamental part of creating customer vizzes – and they are not that hard to understand and use. Here we will look at what each statement does, its syntax, and some use-case examples See the video Link to YouTube 1 If/Then statements […]
Fiscal Calendar YTD and PoP
The most frequently searched post on my blog is on how to do YoY and YTD calculations. But it only works with actual calendar dates. Those of you who have to use a fiscal calendar face an added problem – Tableau date functions only work with actual calendar dates. Here we will look at how […]
Calculating Averages or Rates – How To
We see and use averages every day – Average rainfall, MPG, or sales per day for example – You learned how to calculate them in grade school but what makes Tableau different? The average is simply equal to: That's easy to understand and yet counting values in Tableau can create problems – Example 1 […]
Filtering Fixed LODs
Using filters with Fixed LODs causes problems for many users. Here we will see "How-to" write a LOD When and how to apply Context or Dimension filters Effect filters have in 2 common use cases Probably the best place to start is with an understanding of what Fixed does and then move on to how […]
Parameters – How-to and Use Cases
For new and more advanced users, alike Parameters are misunderstood and misapplied! Parameters are a function that allows the user to manually input a single value into a Tableau workbook. Not that difficult – Manual input – not based on a calculation or another field – the value can be any data type – Dates, […]
Just what does Include or Exclude Do
Include and Exclude – the other 2 LODs – How often do you use them? If you are like most, less than 20% of the time. So what do they do and when do you use them? – confused? me too! Here we will focus on how to use the Include and Exclude forms of […]
Viz-In-Tooltip
Viz-In-Tooltip adds versatility and makes it easy for your user to get to the story hidden in your data. They are not difficult to use and let users see the detail without leaving the face of your worksheet – OK I'm sold – but what are they? (see the video : YouTube VIT link Hovering […]
Sets and Set Action Use Cases
Do you use sets? If not why not? Sets are not like Groups or Filters: Sets categorize your entire data set into 2 segments – Records are either "In" or "Out" based on the value of a single dimension. All the data in the data table and available for use in any type […]
6 Types of filters and how they affect the data table
Filters are easy to use, but why are they so often a source of confusion? (see the Data Dr recording at video recording here ) There a 6 unique types of filters – each has a specific purpose and is applied at different points in the order of operation as you load data structure the data […]
Table Calculations – When, Where and How
Want to total across the row or column, rank a dimension, or pick out a single value? Then you need a Table Calculation! But how? Table Calculation Basics Table calculations should feel familiar. They operate on the table you see in the view much like those from spreadsheet calculators. The actual "data […]
Drilling down in Top N and Other
A frequent user question is how to find the Top N and then group and total all the remaining items into a single category "Other" A common problem with many business applications – determining the Top N can be easily done in several ways. (Presented on VizConnect – see the recording at Link […]
Sets and Filters the Condition and Top N Tabs – What do they do?
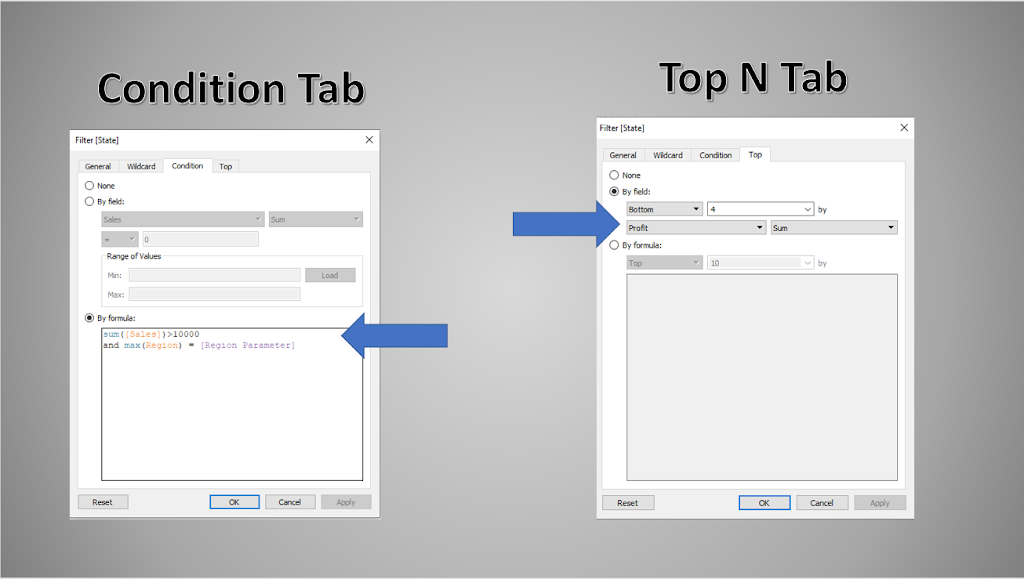
How often do you use the "Condition" or "Top N" tabs – and have you ever used them together? See how… Here we are going to look at how to use Conditions and Top N in combination with Sets and Filters – The Condition and the Top N tabs are on the […]
5 Ways to do YoY and YTD –
YoY and YTD – 5 Ways YoY and YTD calculations are fundamental business metric – after all who doesn't want to know how they compared to last year, last month or how they are tracking on a year to date basis. It seems that users at all experience levels have questions on how to complete […]
Zero to Zen and 5 Stops Along the Way
Zero to Zen covers the 5 foundational concepts I needed to learn on the journey from spreadsheets to Tableau Like many, I struggled when first introduced to Tableau 5 years ago. I don't come from a data scientist background. – Actually, I'm an engineer, very analytic and expert level spreadsheet skills but I just didn't […]
When and How to Scaffold Data
When and How To Use Scaffolds The data structure has a huge effect on the results you get from your analysis. Like most of you, I trained using well structured and full data sets – where there was a value in every record (cell) – like a tightly fit puzzle (Note – Presented that the […]
My Top 5 Building Blocks on the Journey from Spreadsheets to Tableau
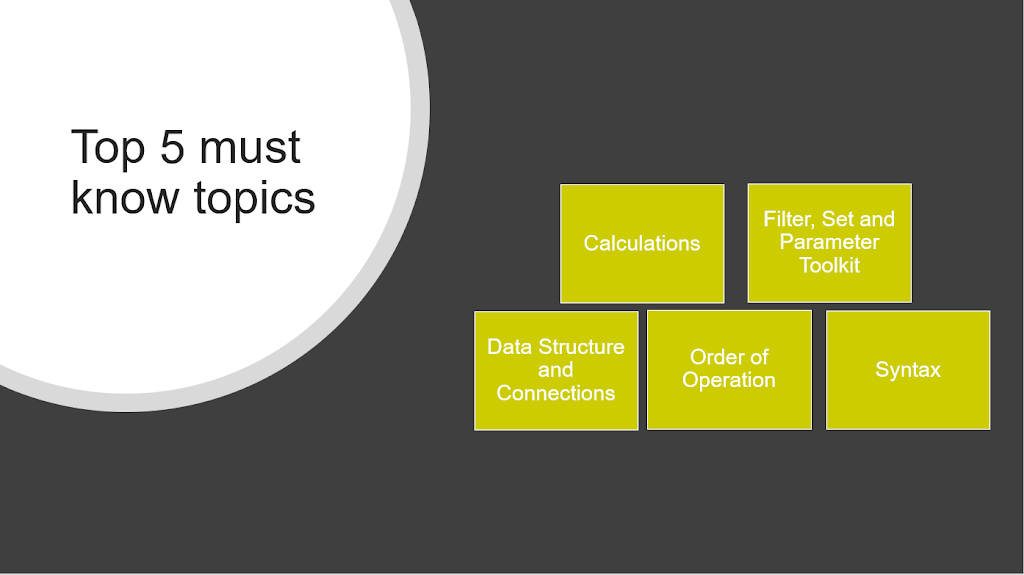
Like many of you, I am not a data scientist. My background is in engineering and marketing. I started Tableau with a lot of experience with Excel mixed with a bit of Access and I struggled for a while – that may sound familiar. Additionally, spreadsheet calculators and Tableau are fundamentally different. Spreadsheets […]
Net Promoter Score
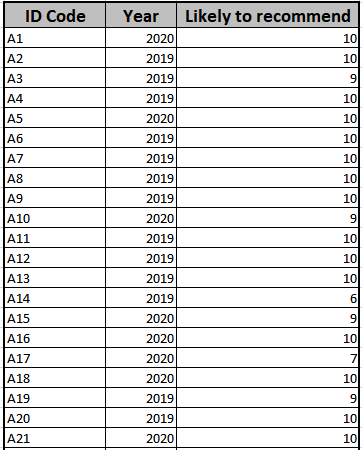
Recently I had someone ask about calculating the Net Promoter Score in Tableau. It's not difficult but first a word on what the NPS is and who uses it – The Net Promoter Score is often used by consumer products companies to measure customer loyalty. It is easy to administer – just collect consumer […]
FAQ Series – Business Days
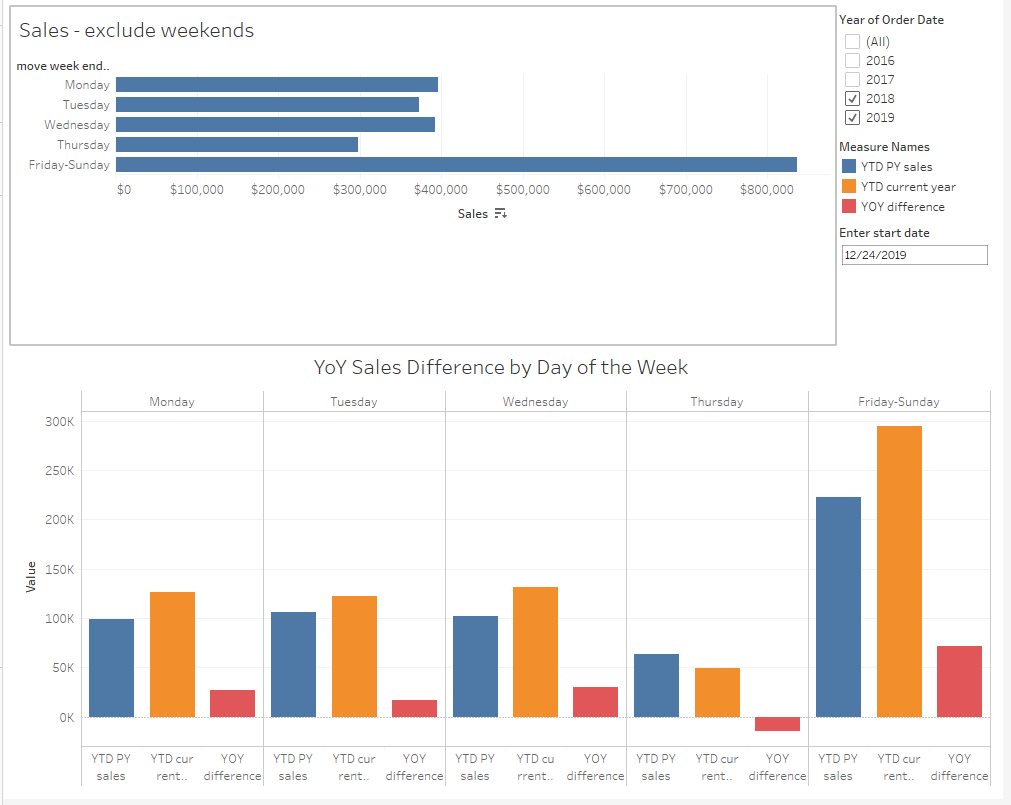
Working with Business Days Often you only want to use "Business Day" in your viz or move the weekend sales to Friday or Monday – In the examples here I will use the US standard Sunday – Saturday week with a Monday – Friday "Business Week" – 1-Weekday Labels […]
FAQ Series – Fiscal Date
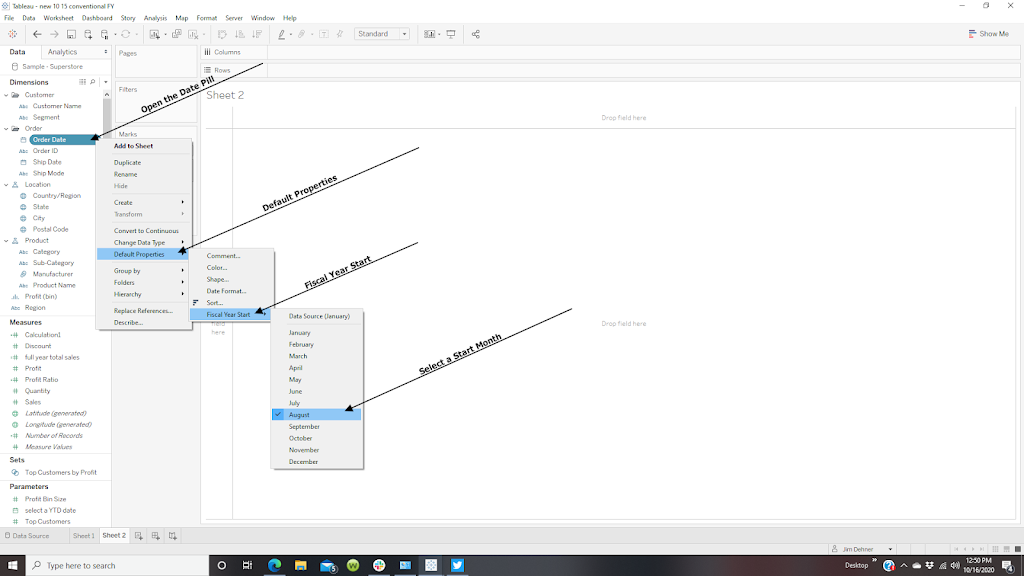
Fiscal Dates Many businesses use a fiscal calendar for accounting and reporting. Their fiscal year can start on the first day of any month and may not align with the start of a calendar quarter. Tableau makes it easy to adjust for the fiscal year start. Open the date field and set the Default Property […]
Duration and Time – Not the same thing
Time and duration are not the same – Time can be read from a clock – duration is the accumulation on intervals – and although we use a common terminology – hours – minutes and seconds they are different This example uses a simple data set consisting of project start and end times by employee Date Functions […]
Context filters – What do they really do?
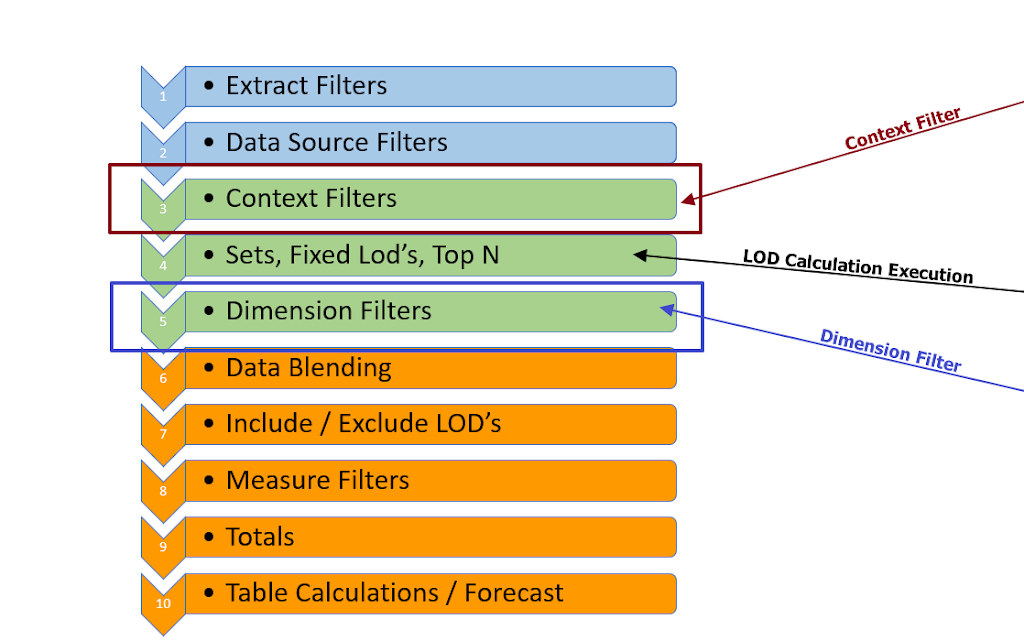
In Tableau, the sequence that filters or calculations are executed is controlled by the Order of Operations – but how does that affect your calculations The order starts with 3 filters – Extract filters limit the data passing from the data source to Tableau, Data Source filters further limit data available in the workbook and […]
Convert String Dates
Dates are a special data type in Tableau the unique properties of being self-sequencing, sorting and can be used in date functions to set ranges, filter and aggregations. But some legacy systems or public sources sometimes cast dates as a single string or individual strings for each date part. Working with “real date” is much […]
Weighted Averages
Weighted Averages Lately, there have been a lot of Forum questions about calculating weighted averages Mathematically, a weighted average is defined as the sum of the individual weights x the values divided by the total of the weights 1 Table Calculation Example Posters are familiar with how to find weighted averages with a […]
Creating Groups
Groups are a way to collect like items without creating an aggregate – They can be static or dynamic, created manually, through a join or as the result of a calculation and spreadsheet users will find them as a useful replacement for a VLOOKUP – Manual Grouping Static groups can easily be created using the […]
Order of Operations
So Just how does the Order of Operations affect your calculations? Tableau, like most systems, has an order or sequence in which filters are applied and calculations are executed. The process starts at the top and proceeds to the bottom in a single pass. Calculations executed lower in the order depend on all the steps […]
Parameters and Parameter Actions
Do you use parameters – I love them and use them a lot – Let's look at them in more detail Parameters are one-way users can directly input a value into Tableau. They are: Single valued – have one value at a time Static the value is constant until manually changed by the user […]
Dates Functions
Date Functions I've had my "issues" with dates – maybe you have too – Date functions allow us to make spectacular charts, compare period sales, and track trends over time. But which one do you use and when? Dates are a very special class of dimensions – they self sequence, have a built-in hierarchy, […]
Show – Hide Filters
Show – Hide Filters Often we will see a Forum question on how to "Filter the view without filtering the underlying data?" Really? What's going on? Load a data set into Tableau, open the Data Source tab, and look at the data – It is the complete data set […]
Not all NULLS are created equal
Not all Nulls are created equal? – Really? Nulls – they break your calculations and mess with your charts but why are they difficult to fix? There are 2 types of nulls each has a different solution Empty Cell Null The easiest to understand and to fix is the Empty Cell Null in your […]
Cannot Mix Aggregate and Non-aggregate
Cannot Mix Aggregate and Non-aggregate One of the most frequent questions we see on the Forum results from trying mixing aggregate and non-aggregates in the same calculation – But why is that a problem and how do you resolve it – Next time you load a data file into Tableau, open the data source tab and […]
Put life in your Viz with Set and Parameter actions and Viz in Tooltip
Set and Parameter Actions and Viz In Tooltip Add life to your vizzes and make it easier on the user by using set and parameter actions and "viz in tooltip" Set Actions Set actions added to the dashboard are an easy-to-use alternative to the drop-down filter. In the dashboard below – the map provides a visual way […]
Zoom in on Map Point with a Radius
"Zoom In" – to Points on Map Recently there have several Forum posts asking how to find all the points that are within a radius of a point and to be able to "zoom in" on the map – something like “I want to identify client locations are within 20 miles of each of […]
YoY – Three different approaches
Year over Year analysis – 3 different ways As the year comes to an end a frequent topic on the Forum is how to complete a YoY analysis – here we will look at 3 different approaches – one using table calculations, one with LOD's and a final way using sets and value pickers. […]
Use LODs to create layer in your data set
Need help using LOD’s – Think of your data set as a pyramid. The data you upload creates the base of the pyramid – the top is the sum of all the data. LOD expressions give you a way to create layers in your data and use those layers to categorize data into dynamic groups, sets, […]
Dynamically sort Top N in a Drill Down Hierarchy
Dynamically sort Top N in a Drill Down Hierarchy Lately, the Forum has been peppered with questions about sorting, ranking, application of filters, and how to make the sort “Dynamic”. So I thought I would take some time to go through a few examples on how to sort in most situations Let’s start at the beginning with examples […]
Use a scaffold to solve the 2 date problem
The most frequently viewed workbook on my Tableau Public site is a solution to the classic 2 date problem. – The data have only a start and end date and you need to know how many programs are active on any date – Ultimately you want something like this The business question can take […]
"How to" Create a Normal Distribution Curve
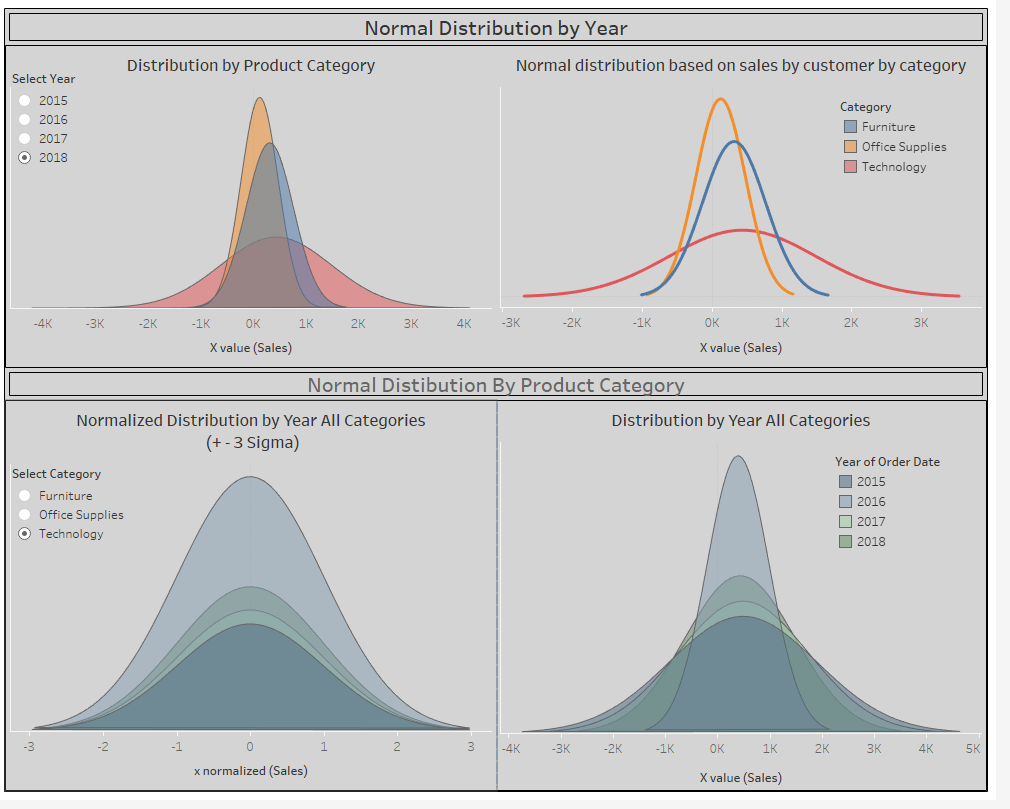
How to Create a Normal Distribution Chart Occasionally there are Forum questions on creating normal distribution curves. The approach here relies heavily on the concept of data densification develop and refined by Bora Beran, Joe Mako, Jonathan Drummey, Ken Flerlage, and others – Readers are encouraged to review their works on creating shapes and […]
See it your way using sets and set actions to navigate your next dashboard
Use sets and set actions to navigate your next dashboard – There are 3 steps Create sets on the dimensions you want to vary Use “Value Pickers” to visually change the set values Create the detail worksheet for your viz – here a map Add Set Actions to the dashboard The example will use […]
More than dots on a map – The renewable energy story
Renewable Energy – How big is it- A dashboard should tell a story beyond just presenting data. It needs to be interesting and when possible encourage the viewer to interact and investigate to make the story their own. This is the end product But that's several iterations later – It started like this […]
BGS – Session 1 – Tableau is not a Spreadsheet
First and foremost, Tableau is not a spreadsheet calculator. That is obvious yet for newbies there is a tendency to try to translate code rather than understand how Tableau works. Have you ever tried to learn a second or third language? In the beginning, you try to translate verbatim into the new language (everyone does […]
BGS – Session 2 – What's a Dimension and What's a Measure
We saw that Excel calculations are cell-based. Each cell contains a copy of a formula: But with Tableau we created a new measure using custom calculations based on Dimensions and Measures Dimensions create categories in the data (in IT speak Partitions) and Measures are the values that are related to the dimension(s)- In the […]
BGS – Session 3 Connecting Data Sets
So far we have just looked at single dataset but you live in the real world data from different time periods, or at different levels or data sources have to be used in the same workbook. You know how to do that with Vlookups and Appends but how would you do that with Tableau? […]
BGS – Session 4 The Order of Operation
The Order of Operation is the single most important thing you need to understand as you progress in your journey. It is the root cause of most mistakes I see in questions posted on the Forum – So what is it – It is the sequence that Tableau goes through each time you create […]
BGS – Session 5 Charts 101
Finally, we get to make some charts – for your first chart start with “Show Me” from the upper right corner of the screen. Select a Dimension and a Measure and click on Show Me. See the video Link to Charts and Basic Calcs A widow open and table shows the common chart […]
BGS Session 6 – Custom Calculations
The ability to add calculations to your viz is key to using Tableau to present insights and tell the story the way you want to. See the video : link to Basic Calcs In this section, we will look at the language of Tableau, the syntax, and how to write some basic calculations. In […]
BGS Session 7 – Special Calculations – Date Functions
Dates are a very special class of Dimension – I mean real dates – not a string (text) that looks like a date or is coded to represent the date. Dates self-sequence, and sort have a built-in calendar hierarchy and can be used as discrete or continuous but most importantly, they can be used in […]
BGS Session 8 – Special Calculations – LODs
Session 8 – Custom Calculations Special Topic LOD Expressions Level of Detail (LOD) expressions are unique to Tableau. Earlier we talked about the grain (the lowest level of data in the dataset. LODs are a way to put additional layers at higher levels of aggregation in the data. See the video – Link to LOD Video […]
BGS Session 9 – Special Calculation – Table Calculations
Want to total across the row or column, rank a dimension, or pick out a single value? Then you need a Table Calculation! But how? See the recording – Link to TC Video Table Calculation Basics Table calculations should feel familiar. They operate on the table you see in the view much […]
BGS Session 10 – Filters
Filters are easy to use, but why are they so often a source of confusion? (see the video Link to Filter Video There a 6 unique types of filters – each has a specific purpose and is applied at different points in the order of operation as you load data structure the data table add […]
BGS Session 11 – Sets and Set Actions
Do you use sets? If not why not? Sets are not like Groups or Filters: Sets categorize your entire data set into 2 segments – Records are either "In" or "Out" based on the value of a single dimension. All the data in the data table and available for use in any type of calculation […]
BGS Session 12 Parameters
For new and more advanced users, alike Parameters are misunderstood and misapplied! Parameters are a function that allows the user to manually input a single value into a Tableau workbook. Not that difficult – Manual input – not based on a calculation or another field – the value can be any data type – Dates, […]
BGS Session 13 Bringing it all together
Now all that is left is bringing it all together with a dashboard. You know have almost all the elements you need to make a compelling presentation on a dashboard – After all they are just a collection of worksheets with some connections and instructions for the users. Where to begin? With a […]