
Weighted Averages
Lately, there have been a lot of Forum questions about calculating weighted averages
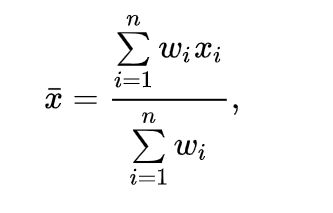
Mathematically, a weighted average is defined as the sum of the individual weights x the values divided by the total of the weights
1 Table Calculation Example
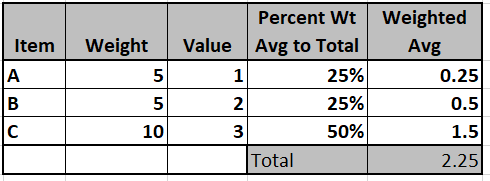
Posters are familiar with how to find weighted averages with a spreadsheet calculator
But now with how it would be done in Tableau –
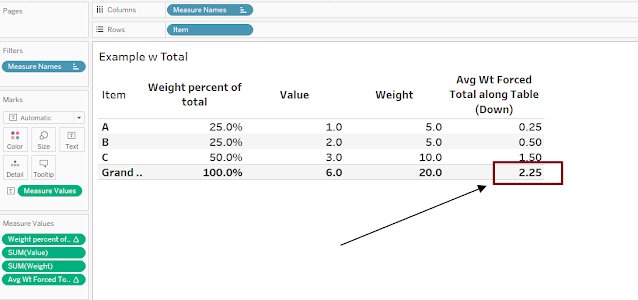
Start with a table calculation to get the percent of total weight :
Weight Percent of total = Sum({Weight]) / TOTAL(Sum(Weight]))
then the row-level weighted averages are:
Weighted Average = [Weight percent of total]*sum([Value])
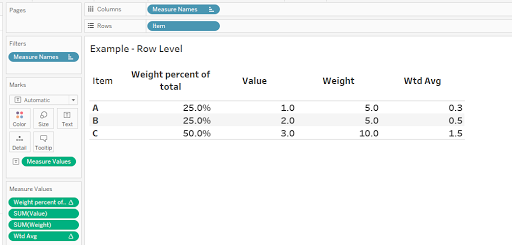
At the row level, the calculations are the same as the spreadsheet calculation
If we add Grand Total – the totals are not correct?
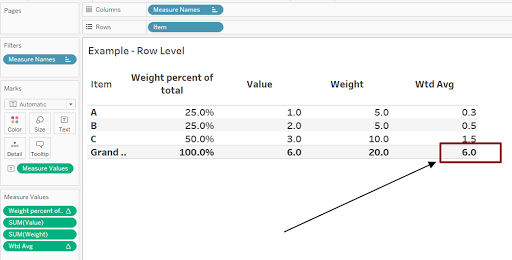
The solution is to include a formula that forces a value into the Grand Total line and the Wtd Avg in all other rows
Size() = 1 is the Grand Total and Sub Total rows or columns
If SIZE()=1 then
window_sum(sum([Value]*[Weight]))/window_sum(sum([Weight]))
else [Wtd Avg] end
and the result returns the expected values:
The solution also works when another dimension is added

set the table calculations to Pane Down
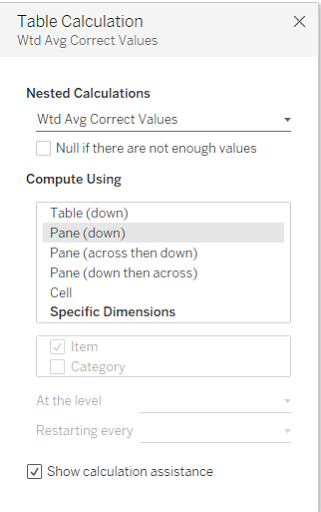
Table calculations are last in the Order of Operations so when possible I use LOD's – I also think the LOD approach is easier to understand – see the next 3 examples
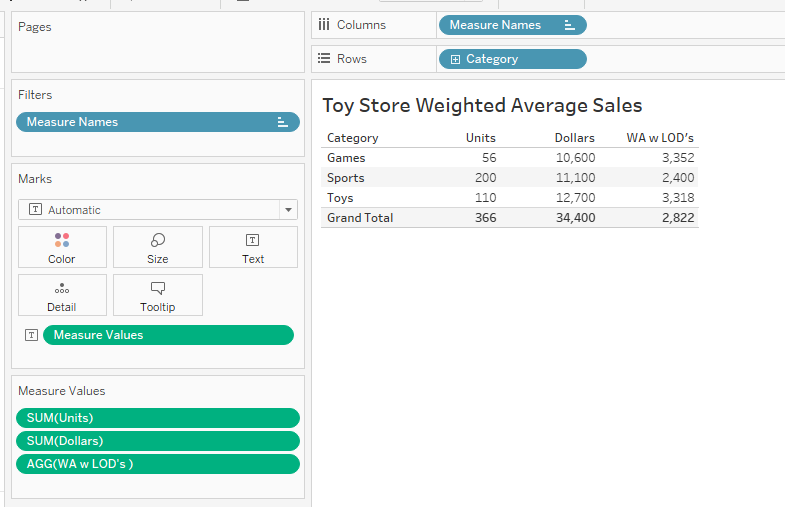
2 – Toy Store Example
Start with a toy store data set – 3 categories with 4 products in each – and determine the weighted average sales by category and overall

The weights are the number of units sold and the values are the dollars –
The numerator can be calculated with an LOD:
{ FIXED [Category],[Item]: sum([Units])*sum([Dollars]) }
The denominator is
({ FIXED [Category],[Item]: sum([Units])})
the weighted average is:
sum([LOD Numerator])/sum([LOD Denominator])
by using LODs the viz can be displayed in detail (including the total and subtotals)

Or the hierarchy can be compressed to show the summary
3 Crime Rate Example
This example uses crime data broken out by region, state, and city to find the crime rate per 1000 population at the state and region level
The data is organized like this
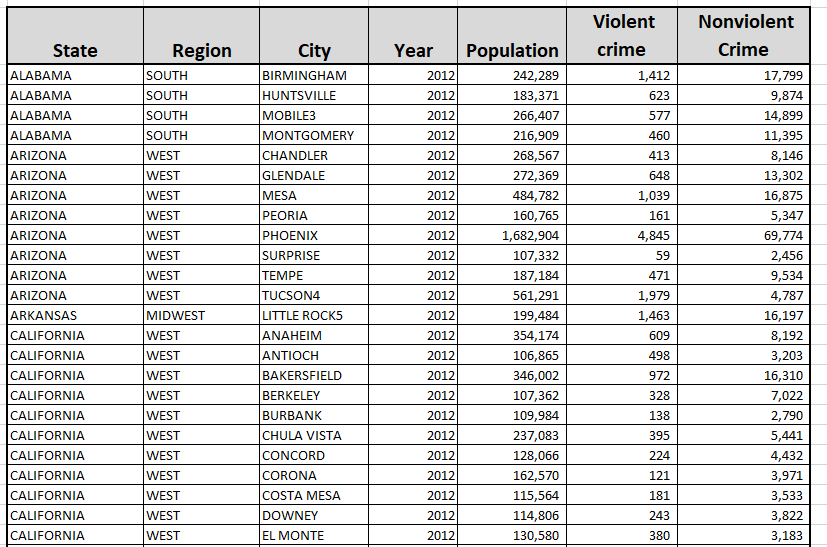
The crime rate per 1000 at the city level can be expressed using Include LOD's – the Include statement at the city level will automatically accumulate the hierarchy is collapsed
– Note also the numerator and the denominator are determined separately
Total crime = sum({ INCLUDE [City]:sum([Nonviolent])+sum([Violent crime])})
Pop In Thousands = sum({ INCLUDE [City]: Round(sum([Population])/1000,1) })
And State Level Wt Avg =
{ FIXED [State]:sum([Total crime])/sum([Pop In Thousands])}
And at the City level sum([Total crime])/sum([Pop In Thousands])
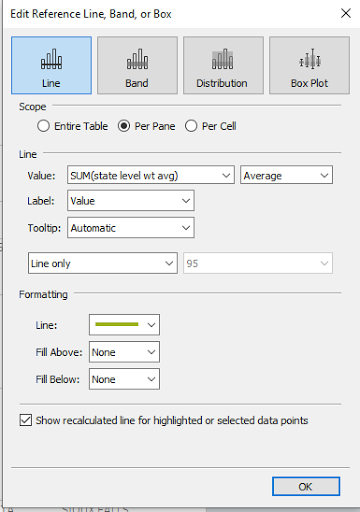
Display the results in map form using a viz in the tooltip to display the crime rate at the city level as bars and the state level weighted average as reference lines

Create a bar chart at the state/city level for city-level crime rate and include a reference line for the state weighted average crime rate

and add a reference line to the columns
Finally on the map – place the detail sheet in the tooltip and filter for State

Hover over a city and the detail chart filtered at the state level opens in the tooltip

4 Weighted Average Interest Rate
A common use case is to determine the weighted average interest across a portfolio of loans
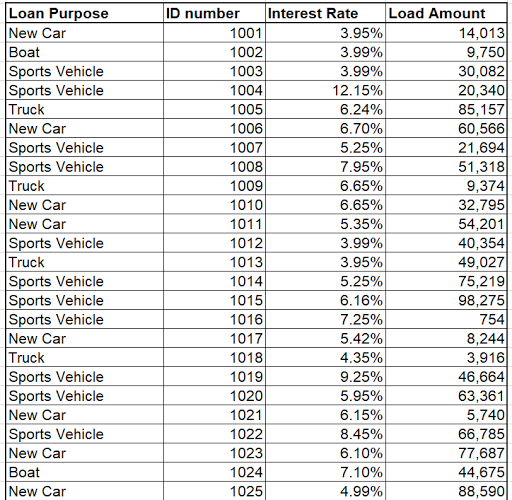
Given the face value of the loan, an the interest rate the first step is to find the interest in dollars for each loan
Interest Dollars = sum([Load Amount]*[Interest Rate])
the weighted average interest rate using an Include LOD (using include the rate will roll up as the hierarchy is collapsed
Weighted ave interest rate =
[Interest in dollars]/
sum({ INCLUDE [Loan Purpose], [ID number] : sum([Load Amount]) })
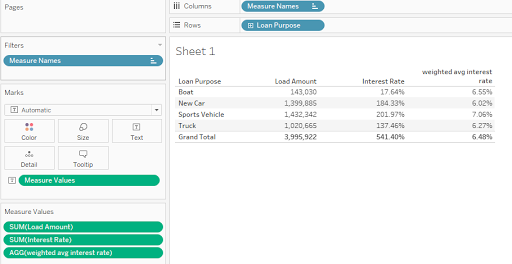
At the detail level, the viz is simply

Collapsing the hierarchy to the loan purpose level and adding in the Grand Total returns the line of business and total portfolio weighted averages
I hope this helps you understand how to calculate weighted averages – the workbooks containing the examples used here can be found at
Enjoy
Jim
