
We see and use averages every day – Average rainfall, MPG, or sales per day for example – You learned how to calculate them in grade school but what makes Tableau different?
The average is simply equal to:
That's easy to understand and yet counting values in Tableau can create problems –
Example 1 – the Avg() function
First, let's look at using the AVG() aggregation function –
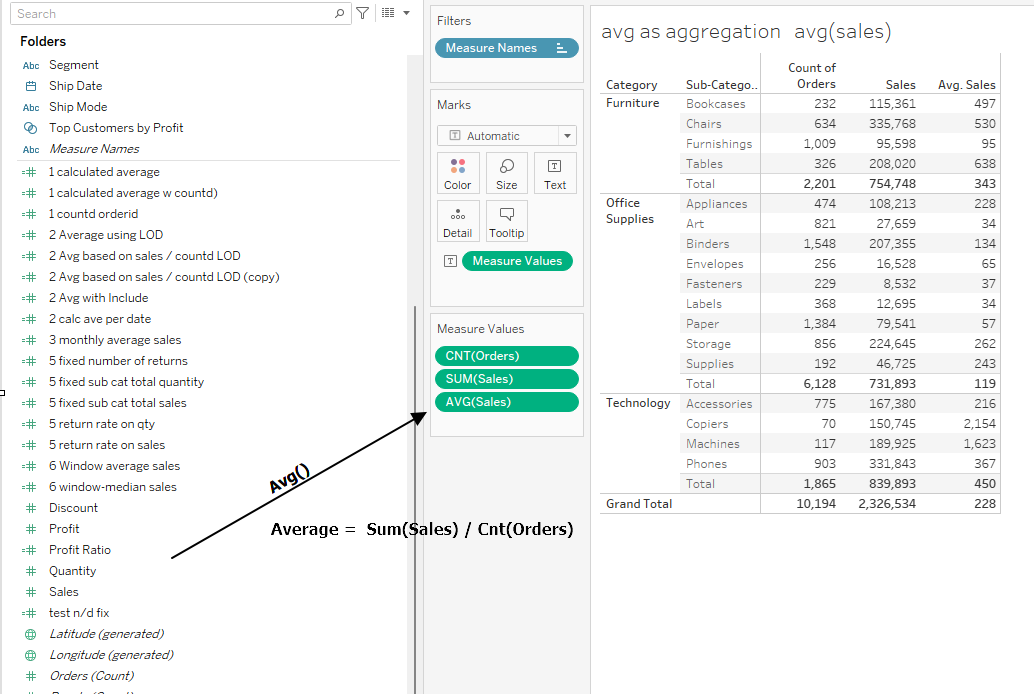
The average sales is the Sum of sales on the individual records in the data divided by the count of those records.
That is what we expected based on the formula – just add up all the sales and then divide by the number of records within each subcategory – Then, using "Grand Total" the sales category is totaled and divided by the number (count) of records in each category.
While that seems simple there are 2 distinct things going on – first the individual records are totaled or counted to produce the average in the subcategory and, likewise the individual records in each category are totaled or counted to get the category average. (i.e. the column is not totaled – Tableau goes back to the individual records and "does the math".
Example 2 – Calculated Average
We can do the same thing by using a formula –
sum([Sales])/count([Order ID])
will produce the same results:
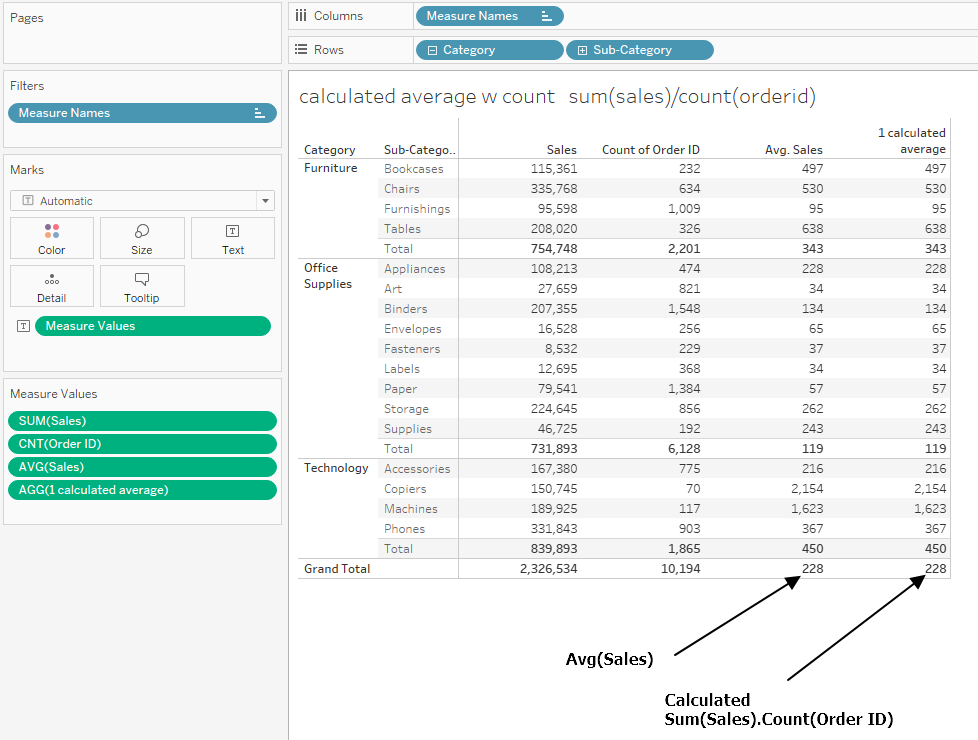
The result may be obvious and at the same time, it illustrates an important point.
The average aggregation function is based on the number of records in the data table – The count() function counts each mark but that may not be what you want. Typically the question is what is the average per order – To get that value we need to count the orders distinctly – not each individual record.
sum([Sales])/countd([Order ID])
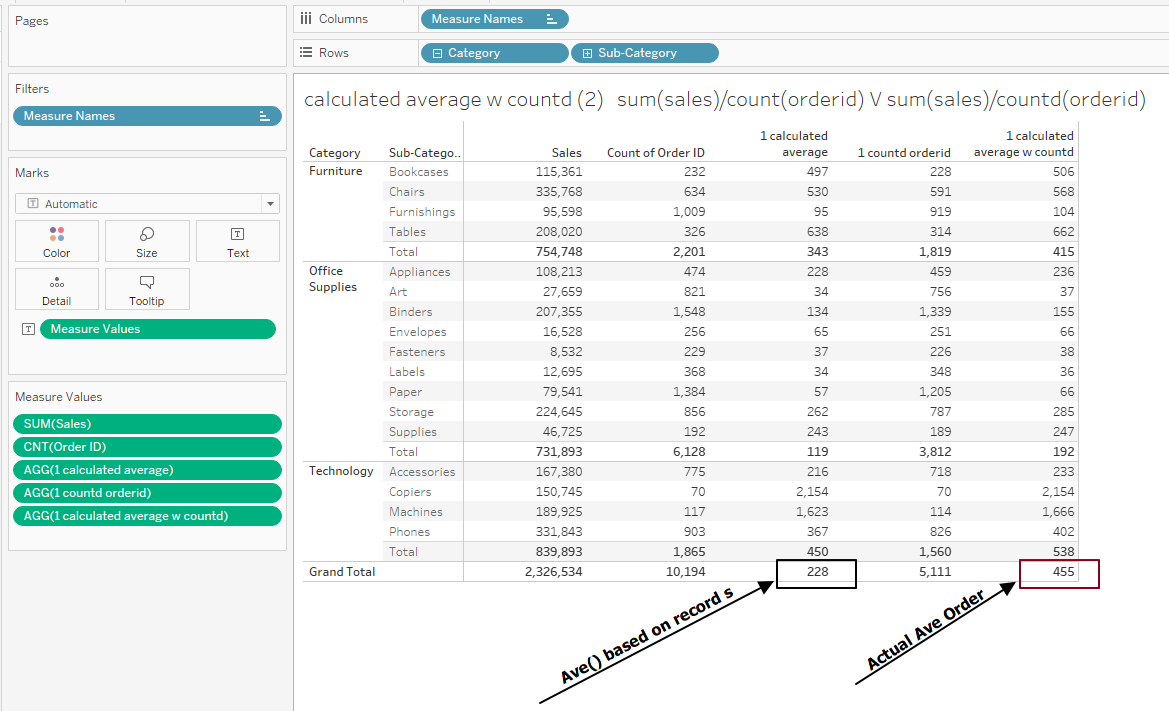
The actual overall average per order is 455 – twice the average based on record count – What would account for that difference?
At the subcategory level, there are some items that have more than one record but the most significant source each order contains a number of line items – those line items can be in different subcategories, categories, or products- the distinct count of orders at 5,111 – where the total record count is 10,194.
So it is very important to understand which average is needed and then "Do The Math" – calculate the numerator (the sum of the date) separate from the denominator (the count of base values – here unique Order IDs.
OK, I went through that in detail because it is central to the understanding of calculating averages, or rates.
Example 3 Using LODs to calculate averages
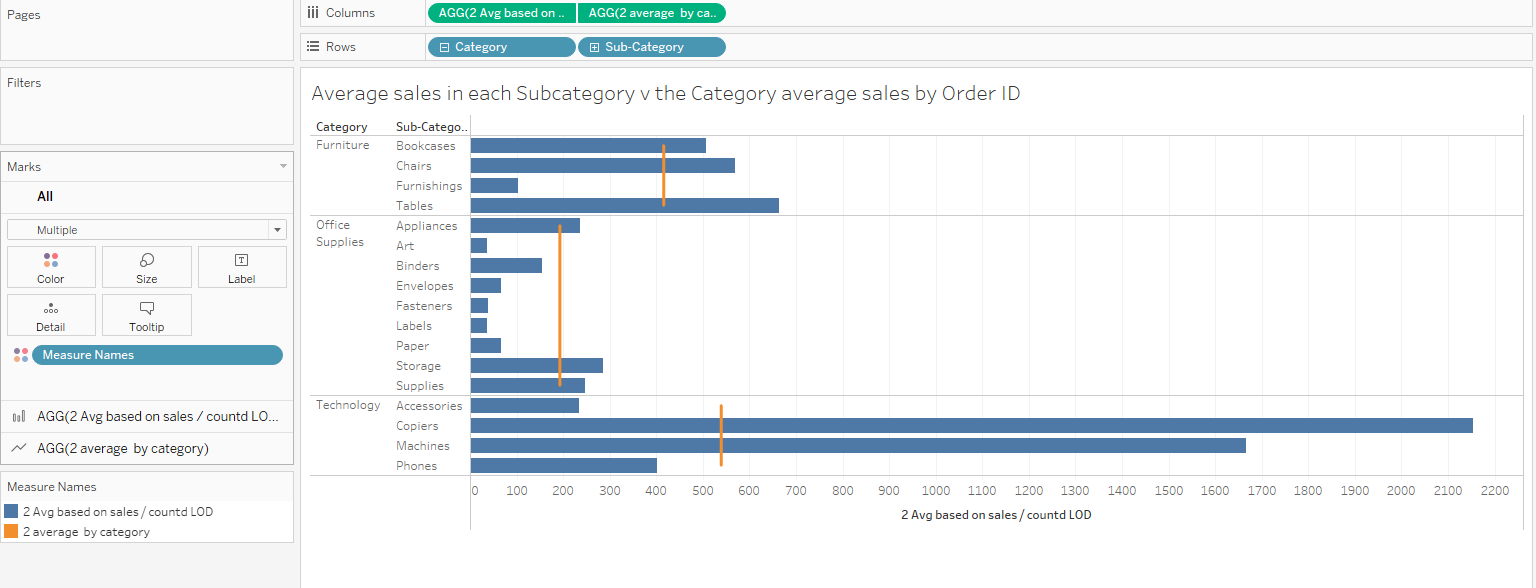
A typical question is to compare the sales in a subcategory to the overall average sale in the category. Here the average sales at the category level can be calculated using a LOD for the numerator and another for the denominator before "doing the math" :
sum({ FIXED [Category]:sum([Sales])})/sum({ FIXED [Category]:countd([Order ID])})
(note the LODs are not aggregates in themselves and need to be aggregated individually)
a common way to look at the result is with a dual-axis bullet chart
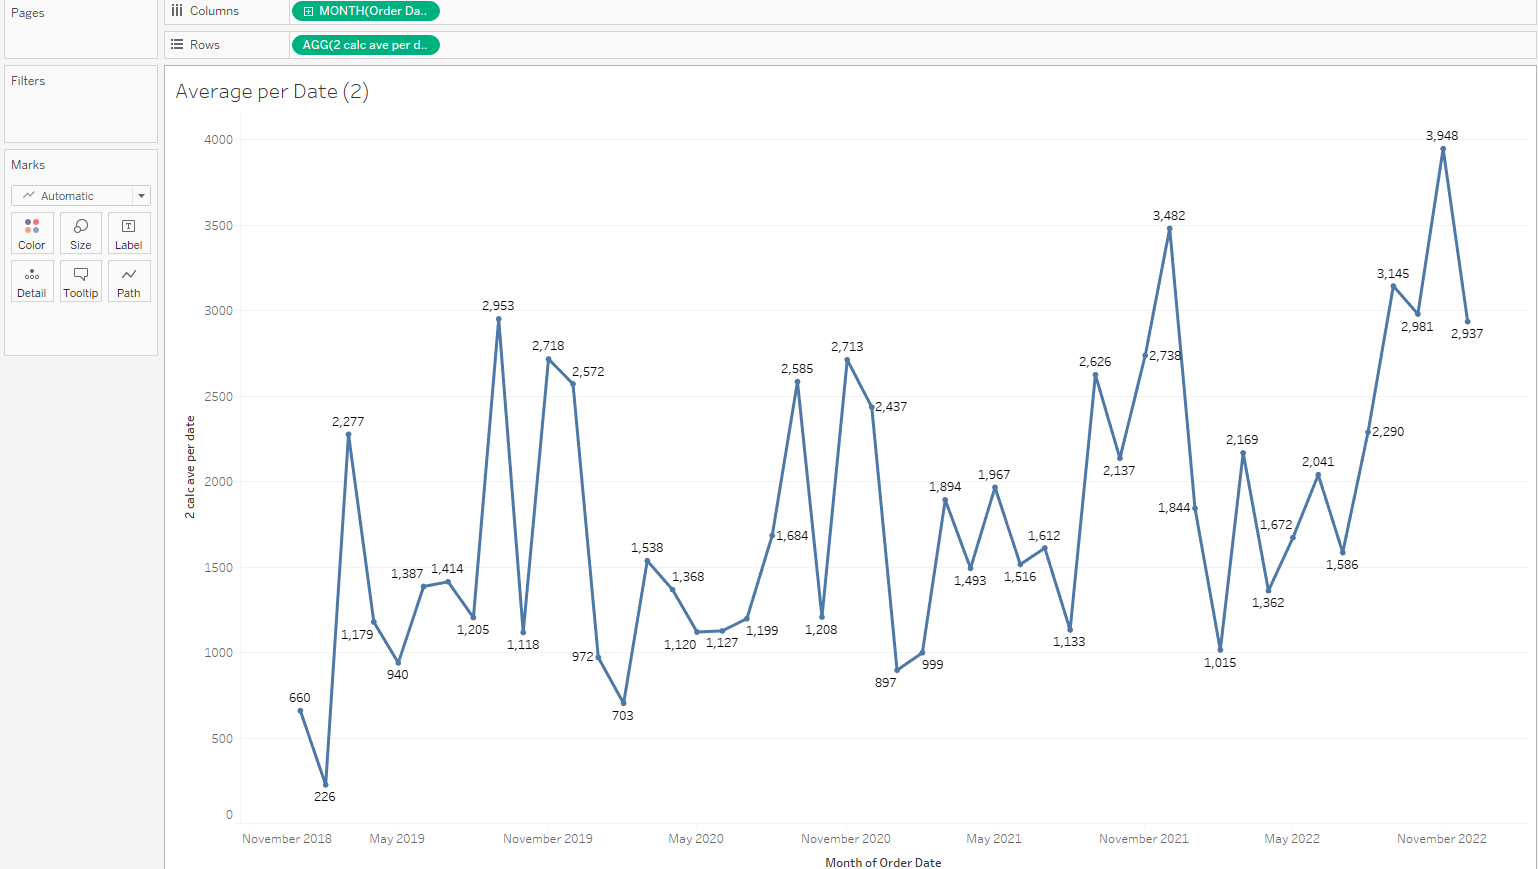
Example 4 Average per Day
While this may be the most basic calculation:
sum([Sales])/countd([Order Date])
that will return this:
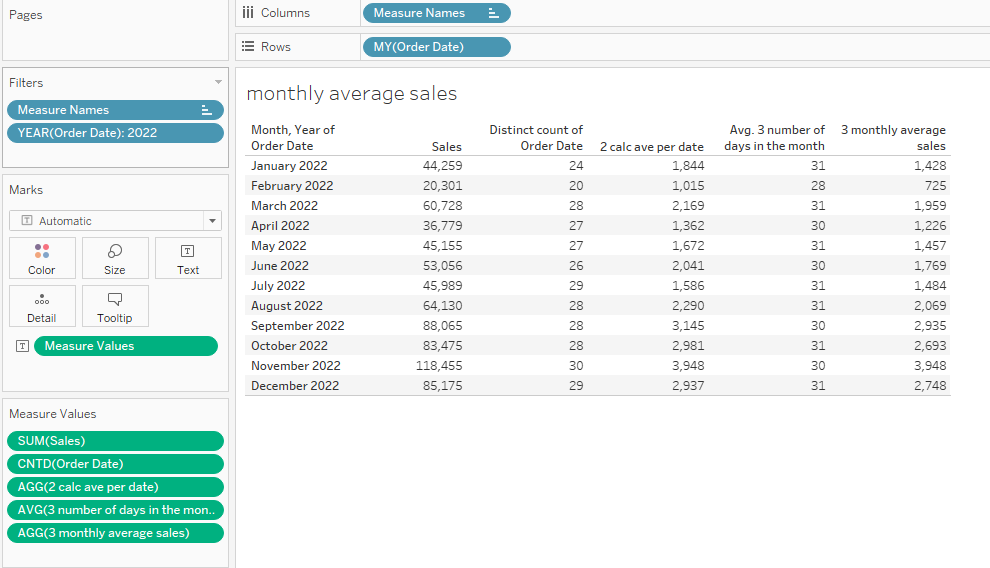
The numerator is OK but it is the denominator that needs to be corrected to the number of days in the month :
you probably are already saying – Hey that is the average sales only for the days there were sales and not the average for all day!
We have to look at how to get the actual number of days in the calendar month
datepart("day", datetrunc('month', dateadd('month',1,[Order Date]))-1 )
and the average sales is then equal to the monthly sales divided by the days in the month
sum({ FIXED DATETRUNC('month',[Order Date]):sum([Sales])})/
sum( { FIXED datetrunc('month',[Order Date]):avg([3 number of days in the month])})
Example 5 Calculating Rates
Rates are calculated in a similar process to the calculations of averages. The only difference is the denominator is not limited to a count of the dimension but can be any aggregation including floating point numbers.
The Superstore data includes Returns – or records that are treated as negative sales. In our example, the net sales can be determined by taking the returned sales from the total for Bookcases of the 878 sold – 66 were returned for a net of 812
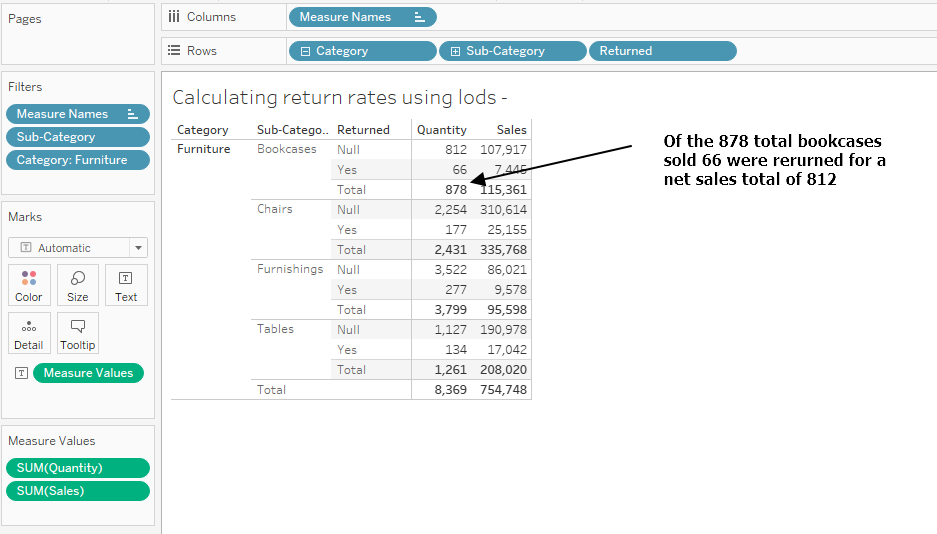
We want to determine the "Return Rate" – the practice in retail sales is to divide the returns by the overall sales total to get the rate.
The numerator here is
{ FIXED [Sub-Category], [Returned]: sum([Quantity])}
and the denominator is
{ FIXED [Sub-Category]:sum([Sales])}
making the calculation for the return rate is
sum(({ FIXED [Sub-Category], [Returned]: sum([Quantity])}))/sum([5 fixed sub cat total quantity])
The resulting return rate by sub-category based on units is
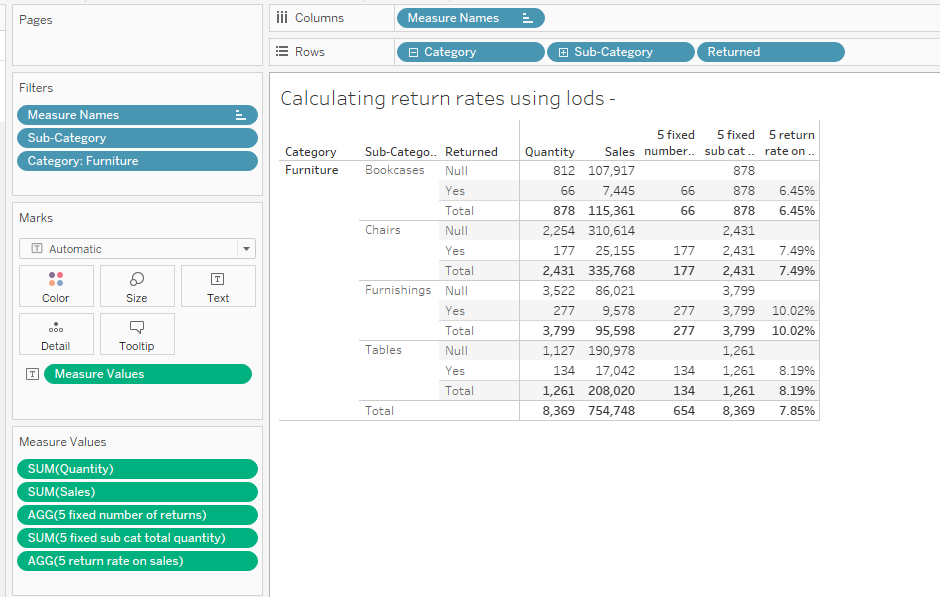
Examples using sales dollar values are included in the downloadable workbook.
Example 6 – Weighted averages
In the previous examples, we were calculating an average or a rate based on the total of a number of records. The count assumes all the individual counts were equal. In this example, we will turn that around to determine an overall weighted average where some records have more weight than others.
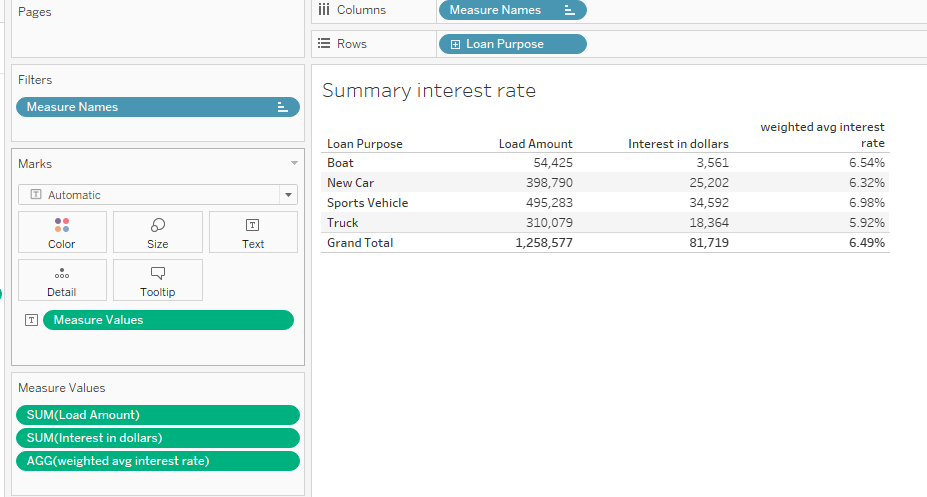
Here we have a loan portfolio with a number of loans, for different purposes, each with a different rate and principal amount. We want to determine what the average rate is for the portfolio as a whole.
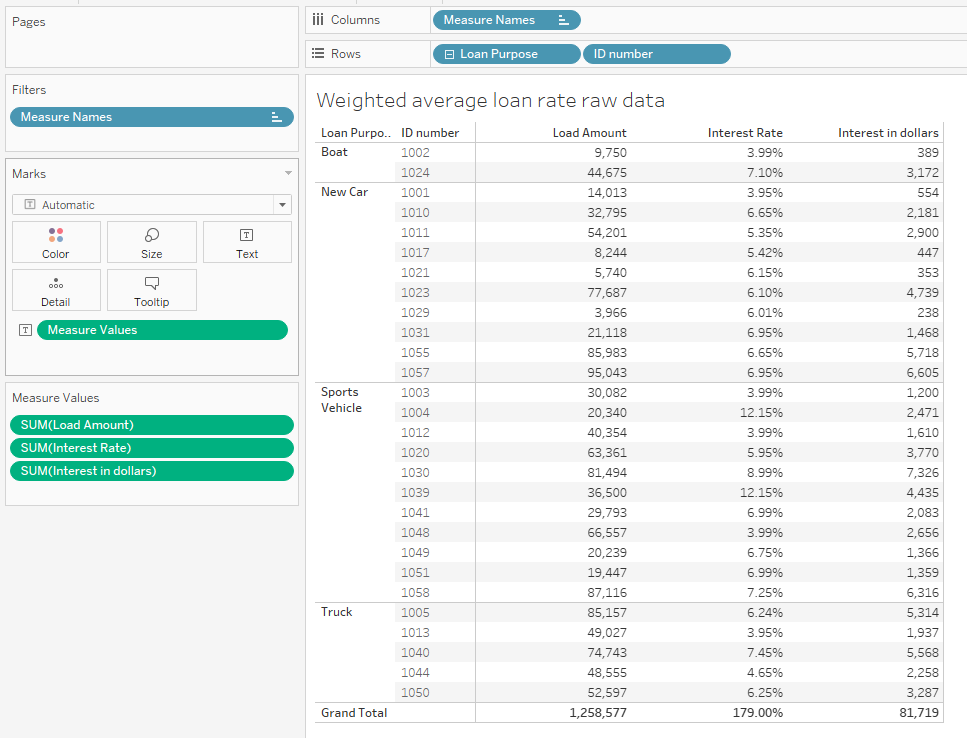
The raw data look like this
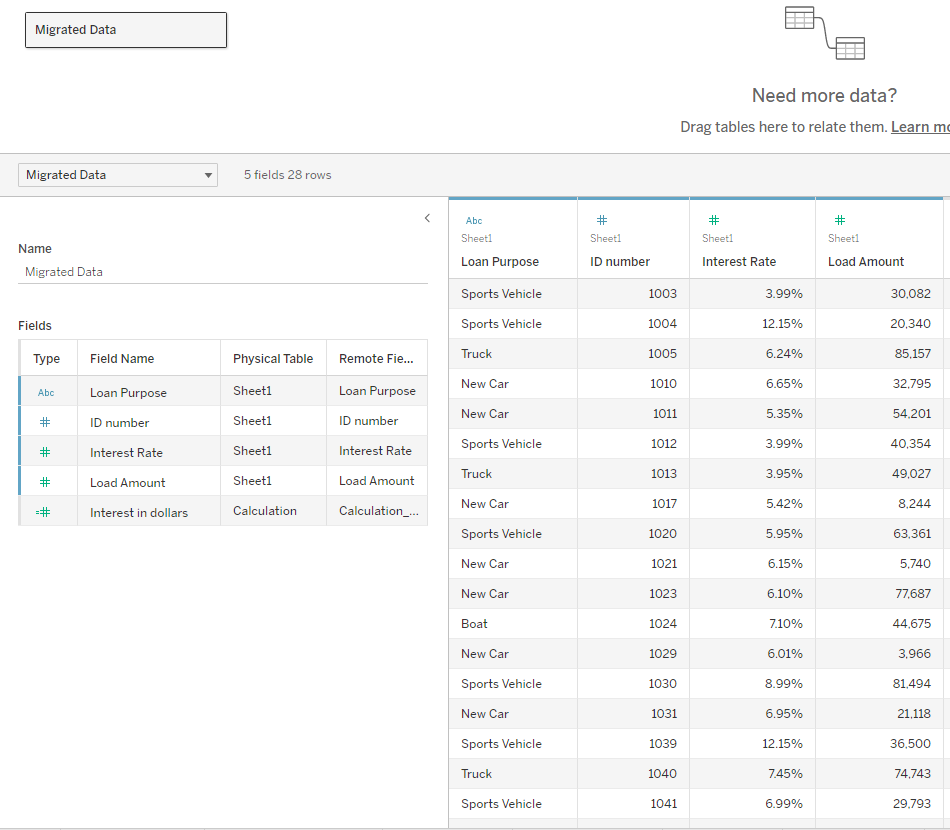
We have the principal and a loan rate but to calculate the weighted average we need to convert the rate to the dollar value of the interest payment. That can be done with this LOD
{ FIXED [ID number]:sum([Interest Rate]*[Load Amount])}
Now it is not absolutely necessary to use a LOD. I like to use them to make totaling and sub-totaling easier.
Then recalculate the interest rate with
sum([Interest in dollars])/ sum(
{ INCLUDE [Loan Purpose], [ID number] : sum([Load Amount]) })
which will be the same as the simple interest at the row level but will weigh the total by the amount of the loan
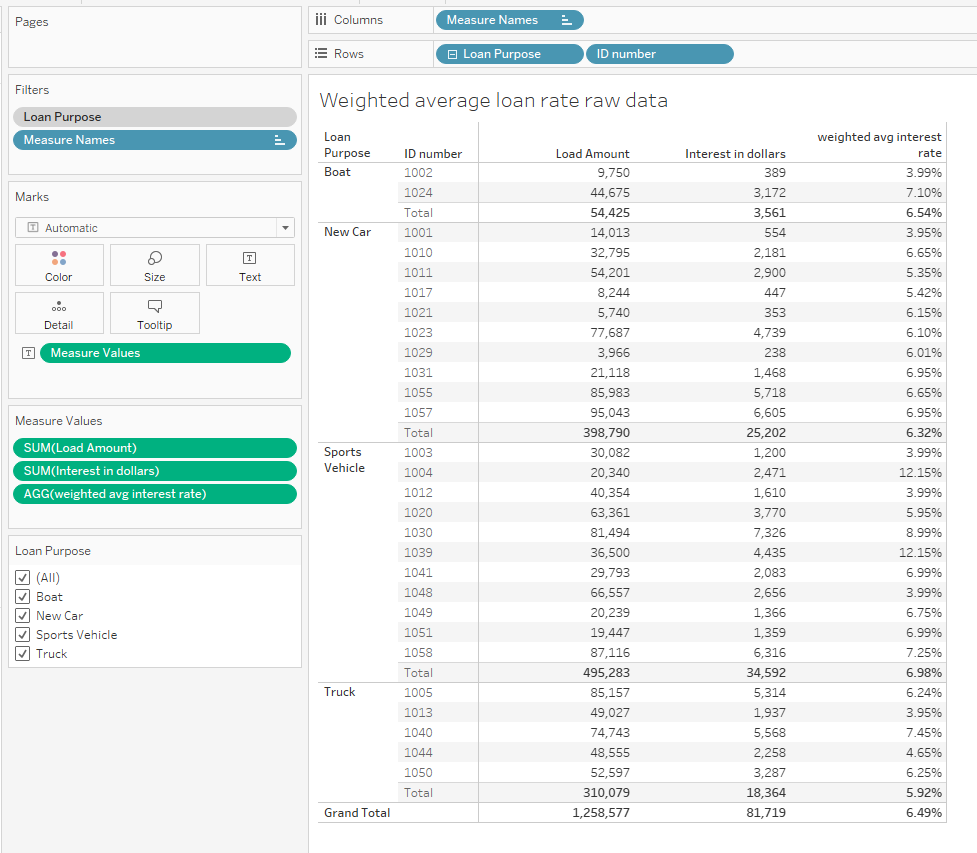
and by using the LOD we only need to see the totals
Averages and rates are easy to calculate once you decide what you want to use for the denominator – I always recommend doing the math and calculating the numerator and denominator separately then do the division –
Hope you agree
The workbook for including the examples shown can be found at Link to Workbook
Enjoy
Jim
