
Shared Dimension – Inventory Analysis
Have you loaded data into a new workbook lately? You probably noticed something different on the Data Source tab. Data can be in Base tables or Related tables, and you can relate data across shared dimensions. I wanted to see how it’s used in doing an inventory analysis. Preparing an inventory analysis has been difficult, […]
Viz Extensions – How to get started
So, you are new to Tableau and heard about Viz Extension. Maybe think – Aren’t those for more advanced users? NO – they were developed to make it easier to use advanced charts, graphs, and tables in your Viz. Got your attention? Then read on- Viz extensions are single-purpose “functions” developed by Tableau and contributing […]
Custom Formatting
We often get questions on how to do conditional format (like the spreadsheets do) – First, Tableau is not a Spreadsheet – see Link BGS 1 if you need confirmation) – In Tableau there is a data table for each worksheet. It is created by dragging dimensions to the rows and columns of shelves. The […]
Filter, Set and Parameter Actions –
Actions – you use them but do you know what they really do? The most frequently used ones simply change a value – that’s right – Granted some will take you places – like “Go to Sheet” or “Go to URL” – and you can highlight – But Filter, Set, and Parameter Actions just change […]
Reference Lines and More
Comparing measures, viewing distributions and identifying outliers can all be done using reference lines! Easy to use and make your dashboards more user-friendly. But lets's start with the basics: See the video at Link to RL video 1 The Analytics Tab: Basic and Custom Reference Line functions can be found on the Analytics tab […]
Tableau Basic Mapping Techniques
Tableau – Basic Mapping Techniques Guest Author Don Wise – Tableau Community Forums Ambassador I think mapping in Tableau is one of the best features of the product. In fact, it’s one of the core reasons my organization selected Tableau over the several available BI products on the market in 2013. I started with Version 7 in […]
Order of Operation and Calculations
The Order of Operation is the single most important concept you need to understand during your journey to learn Tableau. So what is the Order of Operation in the first place? Simply stated it is the sequence Tableau follows each time you create a new worksheet. I like to use the 10-step model […]
Dynamic Zone Visibility – Use Cases
With the introduction of Dynamic Zone Visibility in version 2022.3, sheet swapping, changing date levels in views, and hiding or showing controls or legends just became much easier to set up and use. So how do you set up DZV and where can they be used? See the video at Link to DZV Dynamic […]
If's, And's, Cases and In's Logical Operator's – How to's
Logical functions like If/Then , Cases, And/Or or In statements are a fundamental part of creating customer vizzes – and they are not that hard to understand and use. Here we will look at what each statement does, its syntax, and some use-case examples See the video Link to YouTube 1 If/Then statements […]
Fiscal Calendar YTD and PoP
The most frequently searched post on my blog is on how to do YoY and YTD calculations. But it only works with actual calendar dates. Those of you who have to use a fiscal calendar face an added problem – Tableau date functions only work with actual calendar dates. Here we will look at how […]
Calculating Averages or Rates – How To
We see and use averages every day – Average rainfall, MPG, or sales per day for example – You learned how to calculate them in grade school but what makes Tableau different? The average is simply equal to: That's easy to understand and yet counting values in Tableau can create problems – Example 1 […]
Filtering Fixed LODs
Using filters with Fixed LODs causes problems for many users. Here we will see "How-to" write a LOD When and how to apply Context or Dimension filters Effect filters have in 2 common use cases Probably the best place to start is with an understanding of what Fixed does and then move on to how […]
Parameters – How-to and Use Cases
For new and more advanced users, alike Parameters are misunderstood and misapplied! Parameters are a function that allows the user to manually input a single value into a Tableau workbook. Not that difficult – Manual input – not based on a calculation or another field – the value can be any data type – Dates, […]
Just what does Include or Exclude Do
Include and Exclude – the other 2 LODs – How often do you use them? If you are like most, less than 20% of the time. So what do they do and when do you use them? – confused? me too! Here we will focus on how to use the Include and Exclude forms of […]
Viz-In-Tooltip
Viz-In-Tooltip adds versatility and makes it easy for your user to get to the story hidden in your data. They are not difficult to use and let users see the detail without leaving the face of your worksheet – OK I'm sold – but what are they? (see the video : YouTube VIT link Hovering […]
Table Calculations – When, Where and How
Want to total across the row or column, rank a dimension, or pick out a single value? Then you need a Table Calculation! But how? Table Calculation Basics Table calculations should feel familiar. They operate on the table you see in the view much like those from spreadsheet calculators. The actual "data […]
Drilling down in Top N and Other
A frequent user question is how to find the Top N and then group and total all the remaining items into a single category "Other" A common problem with many business applications – determining the Top N can be easily done in several ways. (Presented on VizConnect – see the recording at Link […]
Sets and Filters the Condition and Top N Tabs – What do they do?
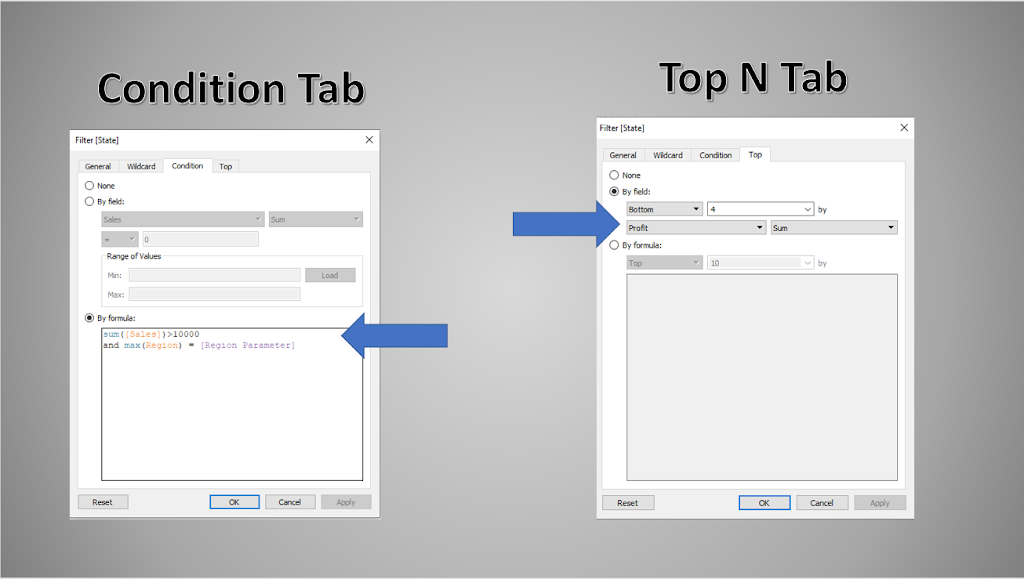
How often do you use the "Condition" or "Top N" tabs – and have you ever used them together? See how… Here we are going to look at how to use Conditions and Top N in combination with Sets and Filters – The Condition and the Top N tabs are on the […]
When and How to Scaffold Data
When and How To Use Scaffolds The data structure has a huge effect on the results you get from your analysis. Like most of you, I trained using well structured and full data sets – where there was a value in every record (cell) – like a tightly fit puzzle (Note – Presented that the […]
Net Promoter Score
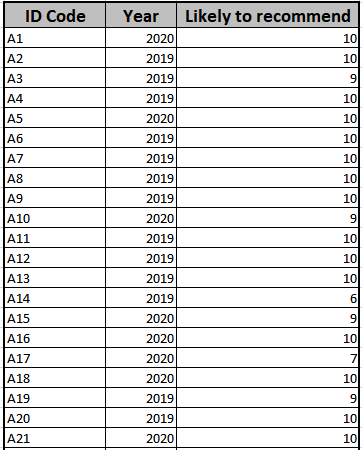
Recently I had someone ask about calculating the Net Promoter Score in Tableau. It's not difficult but first a word on what the NPS is and who uses it – The Net Promoter Score is often used by consumer products companies to measure customer loyalty. It is easy to administer – just collect consumer […]
Duration and Time – Not the same thing
Time and duration are not the same – Time can be read from a clock – duration is the accumulation on intervals – and although we use a common terminology – hours – minutes and seconds they are different This example uses a simple data set consisting of project start and end times by employee Date Functions […]
Creating Groups
Groups are a way to collect like items without creating an aggregate – They can be static or dynamic, created manually, through a join or as the result of a calculation and spreadsheet users will find them as a useful replacement for a VLOOKUP – Manual Grouping Static groups can easily be created using the […]
Parameters and Parameter Actions
Do you use parameters – I love them and use them a lot – Let's look at them in more detail Parameters are one-way users can directly input a value into Tableau. They are: Single valued – have one value at a time Static the value is constant until manually changed by the user […]
Show – Hide Filters
Show – Hide Filters Often we will see a Forum question on how to "Filter the view without filtering the underlying data?" Really? What's going on? Load a data set into Tableau, open the Data Source tab, and look at the data – It is the complete data set […]
Cannot Mix Aggregate and Non-aggregate
Cannot Mix Aggregate and Non-aggregate One of the most frequent questions we see on the Forum results from trying mixing aggregate and non-aggregates in the same calculation – But why is that a problem and how do you resolve it – Next time you load a data file into Tableau, open the data source tab and […]
Put life in your Viz with Set and Parameter actions and Viz in Tooltip
Set and Parameter Actions and Viz In Tooltip Add life to your vizzes and make it easier on the user by using set and parameter actions and "viz in tooltip" Set Actions Set actions added to the dashboard are an easy-to-use alternative to the drop-down filter. In the dashboard below – the map provides a visual way […]
Dynamically sort Top N in a Drill Down Hierarchy
Dynamically sort Top N in a Drill Down Hierarchy Lately, the Forum has been peppered with questions about sorting, ranking, application of filters, and how to make the sort “Dynamic”. So I thought I would take some time to go through a few examples on how to sort in most situations Let’s start at the beginning with examples […]
"How to" Create a Normal Distribution Curve
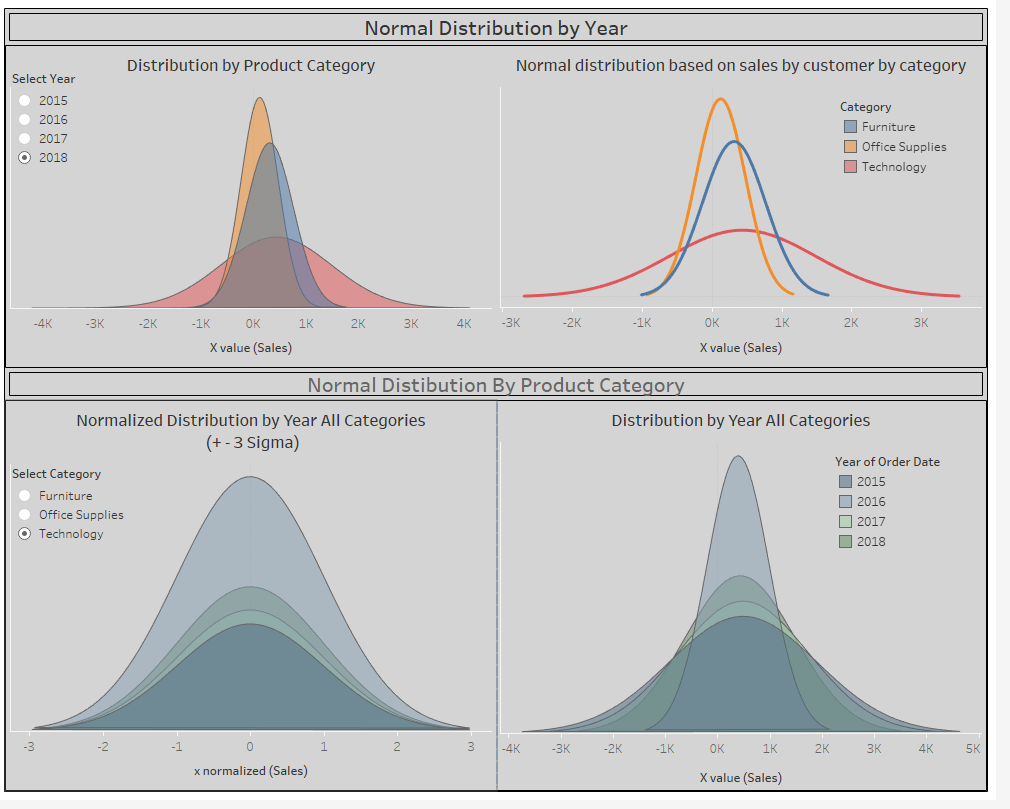
How to Create a Normal Distribution Chart Occasionally there are Forum questions on creating normal distribution curves. The approach here relies heavily on the concept of data densification develop and refined by Bora Beran, Joe Mako, Jonathan Drummey, Ken Flerlage, and others – Readers are encouraged to review their works on creating shapes and […]