
Using filters with Fixed LODs causes problems for many users.
Here we will see
"How-to" write a LOD
When and how to apply Context or Dimension filters
Effect filters have in 2 common use cases
Probably the best place to start is with an understanding of what Fixed does and then move on to how they are affected by filters.
Think of your data as a pyramid. The base of the pyramid is the data you uploaded. The pointed top is the total of all the individual records. Fixed LODs create layers in your data set that are in-between the lowest level and the top of the pyramid.
You decide where to place the layers using a combination of dimensions and, while Sum() is the usual aggregation you can use avg(), max(), stdev(), or any of an available variety).

The calculation returns a value that is an aggregation of lower-level data, but the field itself is not an aggregate. Similar to a subtotal, it can be used in any other type of calculation.
Let's look at the syntax and then some filtering examples: (I will be using Superstore data in the examples and use 3 dimensions from that data Region (4 values), Segment(3 Values), and Category (3 values) – there are 10,000 records in the Superstore dataset
{Fixed Region, Segment,Category: Sum(Sales)}
The LOD is always enclosed in curvey brackets {} and uses the keyword Fixed. That is followed by a string of dimension names and a colon : The combination of dimensions that come next determines the level in the pyramid you need – In this case there are 3 segments, 4 regions, and 3 categories – so 3X4X3 will result in 36 total point.
The value to be stored in those points is determined by the expression that follows the colon – in this case, the sum(sales).
A column has been added to the dataset for the LOD. For each of the 10,000 records in the Superstore dataset, the value in that column will one of the 36 values determined by the combination of Region, Segment, and Category in the record. (The 36 values below)

OK – Now let's see how Fixed works and how it is affected by filters
The sequence for the application of filters is controlled by the Order of Operations.

Fixed LODs are calculated in Step 4 adding a new column of data in the data set-
Context filters are applied in Step 3 and filter at the detail record level (the 10,000 records in the Superstore data set for example) BEFORE the LOD is calculated. Since the data is filtered out before aggregation, it is not in the LOD (Note Context filters appear as Gray pills on the filter shelf)
Dimension filters are applied in Step 5 AFTER the LOD has been calculated and eliminate the entire row of data from the data table including the aggregated LOD value. (note Dimension filters appear as Blue pills on the filter shelf)
While the rules around Context and Dimension filter application seem simple enough, their application can be confusing.
There are a limitless number of examples that can be made using LOD expression. Here we are only looking at 2 – the percent to total and the max date. We will look at the expression at different levels and see what happens when filters are applied.
1 Overall (Table) LOD
We'll start with an overall Fixed statement that is the equivalent of the total for all records in the data set – the expression is useful to find the percent to total or to find the max value in the data set or the latest date
It can be written in two ways (they are equivalent and will return the same result:
{Fixed : Sum(Sales)}
Or you can use what is known as a Table LOD that looks at the entire data table
{Sum(Sales)}
The expression returns a single value

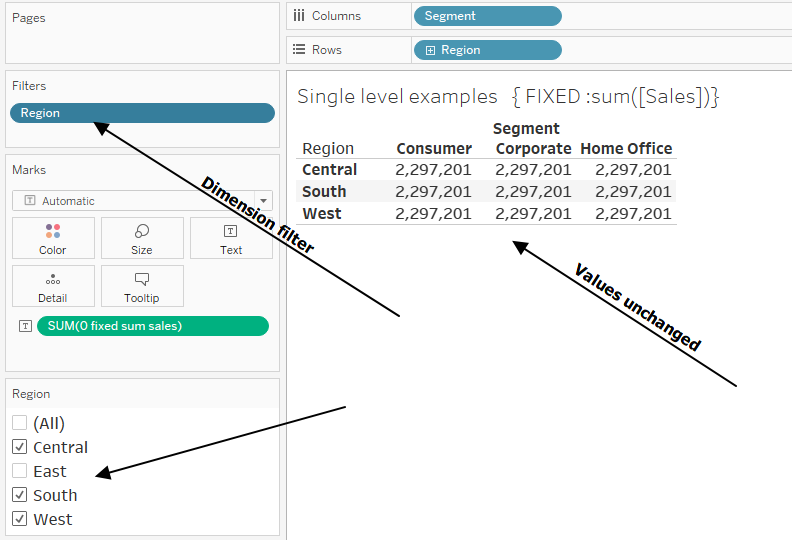
if we add other dimensions to the rows or columns the value of the expression is unchanged:

Let's see what happens when we add a filter on Region (for a complete discussion on filters see 6 Types of filters and how they affect the data table)
First, as a Dimension filter (Blue pill Not in Context) – Dimension filters are applied after the Fixed LOD is calculated so "East" has been filtered out of the view but the LOD total remains unchanged
Filters on Dimensions in Context (Gray pill) are applied before the LOD is calculated – filter East removes the region from the view and the LOD value now excludes the East region

The same can be seen when filtering dimensions not in the view. Here Category is not in the view –
Category is applied as a Dimension filter (Blue pill) and the value of the LOD is the original total in all regions and segments

Now placing Category in Context and filtering out Office Supplies before the LOD is calculated changes the value to:

That is all you need to remember about filters and their effect on LODs – if you want the filter applied before the LOD is calculated then place the Dimension into Context. If you don't want the LOD to reflect the application of the filter do NOT place the filter in Context –
2 Overall LOD use case examples
Let's see how the overall LOD can be used to determine the percent of total or the latest sales value
To calculate the percent of total we need the total sales value for the denominator
{ FIXED :sum([Sales])}
and the numerator is just the sales value – but notice LODs are not an aggregate so we need to use sum() in the numerator and in the denominator
sum([Sales])/sum([1 Fixed sales])

as expected, applying a Context filter on East will apply the filter before the LOD is calculated and the percent of total is based on the 3 remaining regions

2 Latest Date
The latest date in the data table can be found using a Table LOD
{max([Order Date])}
and then applying a conditional statement based on the last date
if [Order Date]=[1 latest date in the data set] then [Sales] end

3 Add a Dimension to the LOD- 1 level
When you add Dimensions to the LOD, you are creating a virtual layer – like a subtotal on a spreadsheet -which you can then use in any other calculation –
{ FIXED [Region]: sum([Sales])}
The LOD will create totals at the 4 regions and store those totals so you can use them in other calculations
The starting point is the same – with no filters applied to Region, Segment, or Category values and Grand Total are the same as the original

Let's see how filtering affects each LOD.
First applying a Dimension filter (i.e. NOT in context) on Region will filter the East region out of the viz but will not change the overall LOD value

Adding the Region dimension to Context and filtering out East happens before the LODs are calculated will affect the overall LOD value but not the Region based LOD – those values are already at the region level
Appling filters to Dimensions not in the view, as before, will affect all LODs when the Dimension is in context

If the Dimension is NOT in Context (a Dimension filter) then neither the region nor overall LOD value is changed – the filter was applied after the LODs were calculated

OK, let's revisit the percent of total and latest date LOD calculation but use the Region LOD to see how they are affected
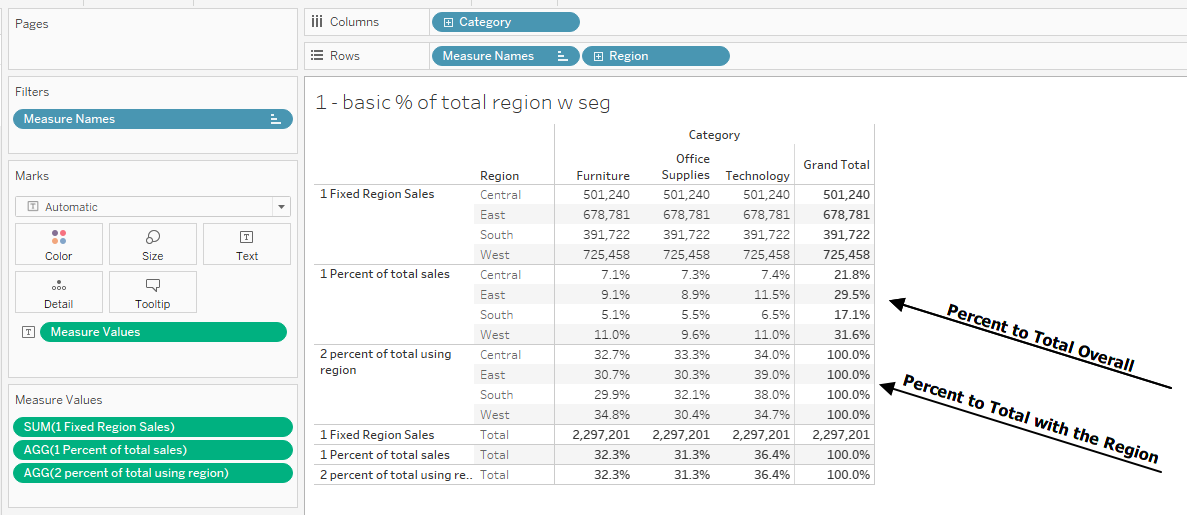
4 Percent of total – Region LOD
To see the effect I have added the Category Dimension to the viz on Columns –
The percent to the overall total is:
sum([Sales])/sum({ FIXED :sum([Sales])})
And to calculate the percent to total at the region level Region has been added to the LOD in the denominator
sum([Sales])/sum({ FIXED [Region]: sum([Sales])})
the percentages overall and in the region with no filtering applied are:
Appling a Dimension Filter (Blue Pill-not in Context) to filter out East leaves all the individual percent to totals unchanged – East has been filtered out of the view and the total of the 3 remaining regions is 70% of the overall unfiltered total sales – remember East was filtered out after the LOD was calculated so the East region LOD values are not in the total
If the filter on Region is placed in Context then East is filtered out before the LOD is calculated so the Overall percent to totals will change but the Regional percentages will not (East is filtered out of the view but there is no effect to the remaining regions

Let's see what happens when we filter on Category, not in context

When the Category filter is placed in Context then Office Supplies is filtered out before the LODs are calculated and all values change

6 Latest Date
Similarly, LODs and be used to find the latest date by region use this:
{ FIXED [Region]: max([Order Date])}
and filters can be applied in or out of Context just like in the numeric calculations above
With no filters applied, the LOD just returns the last date for any record in the Region regardless of the Category or Segment (i.e. the "Fixed" latest record in the Region)

As expected if the Dimension filters are not in context then filters are applied after the LOD is calculated and the dates are unchanged but the view is changed

When the dimensions are placed in Context the latest dates now reflect the last record for the Segment, Region combination

If we add a filter directly on date but the filter is not in Context then it is applied after the LOD is calculated and the last dates in the data set are returned

but if all filters are placed in Context then the LOD will filter out 2022 and return the last date by region and segment resulting:

7 Filtering with multiple dimensions in the LOD
I would like to do one more example. This one with 2 dimensions in the LOD:
{ FIXED [Region],[Segment]:sum([Sales])}
There are 4 regions and 3 segments so 12 values are returned by the expression:

if we drop in Category the 12 values are repeated for each value of the Category dimension – as expected:

We can start adding filters, first on Region and Segment NOT in Context –
The filters are applied after the LOD is calculated – only 6 values are visible in the views but the individual values remain unchanged – (remember when you create a LOD the aggregation is made at the level of the combination of dimensions and stored for later use)

The Grand Totals have changed because they are the sum of the 6 LOD values in the view.
Now place the Segment and Region filters in Context – What happens?

There are the same 6 values and the Grand Totals are the same – Why would that be?
The LOD is at calculated at the Region / Segment level and the values are independent of each other. Filtering out the base record before the LOD is calculated or filtering out the aggregate after the LOD is evaluated will return the same result.
Now see what happens if we add a filter on a dimension that is not in the LOD dimension list – here Category
The starting point is the same – without any filters applied to any dimension the 12 values are unchanged:

When we apply a Dimension Filter (Blue pill) not in Context to dimension:

The filter on Category is applied after the LOD is calculated so there is no change in the output
But if the filter is placed in Context (Gray pill) and the individual records for Office Supplies are filtered out before the LOD is evaluated then all the LOD values are affected

Please experiment with other combinations of filters in and out of Context – they all follow the same rule – when the Dimension is in Context (Gray pills) the individual records are filtered out before the LOD is calculated – if applied as Dimension filters (Blue pills) they are applied to the results the LOD after it is evaluated
We could carry this on by adding more dimensions to the LODs and creating layers deeper in the dataset, but the effect is the same.
Hope this helps clear up how to use filters with Fixed LODs. It takes some practice so get busy –
Also – see the VizConnect Data Dr recording at Filtering Fixed LODs
The workbook containing all the examples used here can be downloaded from my Tableau Public site at Download filtering workbook
Jim

4 Responses
Hi Jim, thank you for this post!
I have an LOD filtering question but I think is a bit different from what you got here.
I am trying to SUM a measure and generate a T/F from it if it is >=0. My calculation:
{ INCLUDE [Service SKU Nbr], [Contract Nbr]:
IF SUM([Contract Line Amt])<=0
THEN FALSE
ELSE TRUE
END
}
The calculation seems correct but when I add it to my filter's card, then I get a measure instead of T/F and I have to select Min/Max, etc. which doesn't really filter the view properly.
Any suggestions to get T/F when dragging the calc to filters? Thank you so much for your help!
Do not use include – use Fixed – if that doesn't solve your issue post the question and your workbook on the Tableau Community Forums
What if you have two fixed calculations, one that requires filters, and one that doesn't? How do you make it work without using context filters since the context filter will apply the filtering to both? Also both need to be fixed calculations because of fields in the calculation that need to be fixed. Is there a way to make that work?
you use a fixed lod on one an include on the other and do NOT place the filter in Context see https://jimdehner.com/2022/06/03/just-what-does-include-or-exclude-do/ the 3rd example