
How often do you use the "Condition" or "Top N" tabs – and have you ever used them together? See how…
Here we are going to look at how to use Conditions and Top N in combination with Sets and Filters –
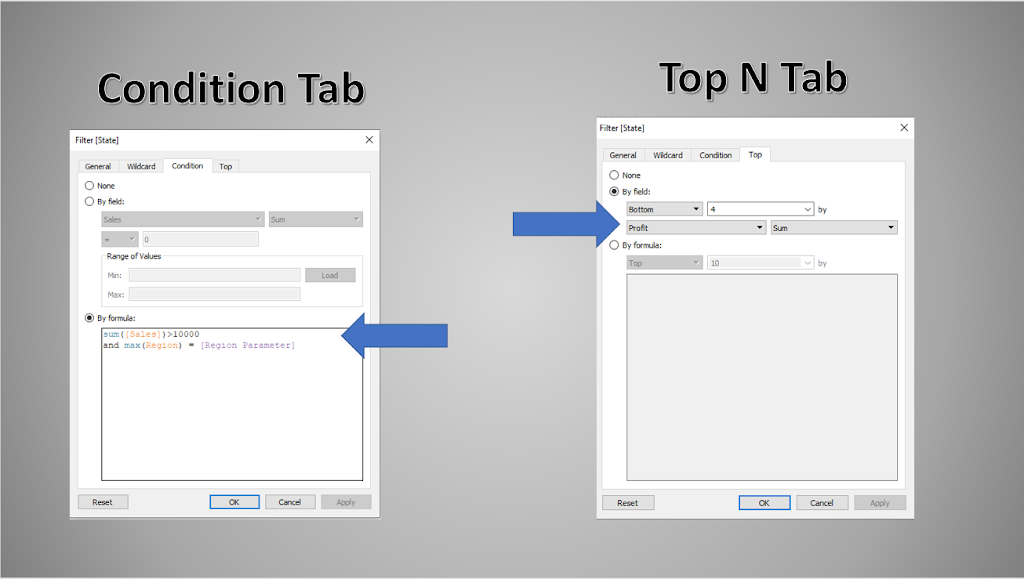
The Condition and the Top N tabs are on the setup for Sets and Filter – They look the same on each and provide the capability to further filter the dimension used in the set or filter. They can interact with each other – in an AND fashion and can be used in combinations with filters on other dimensions or sets – (Presented at VizConnect Link to Recording)
Example 1 – Simple Filter
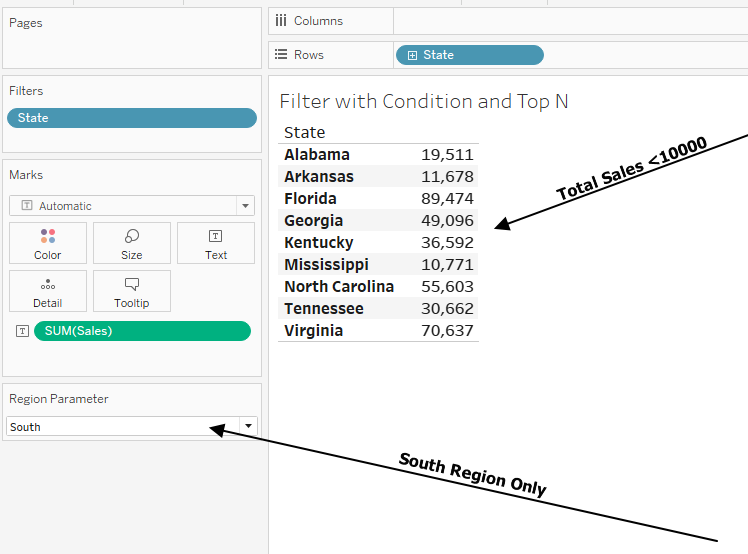
Using Superstore data, I've created a parameter on Region and a filter on State with this formula on the condition tab –
Sum([Sales])>10000 and Max(Region) = [Region Parameter]
The Formula window works like a LOD – dimensions, and measures must be aggregated and you can not use ATTR(). The condition will filter out all States with total sales less tha10000 and only states in the Region selected in the parameter will be included.
Now add in a Top N type filter ( I used the Bottom 4)

And the Bottom N is applied in addition ( AND filtering ) to the filters applied on the condition tab.
Before seeing more complex examples we need to see how the Order of Operation will affect the filtering.
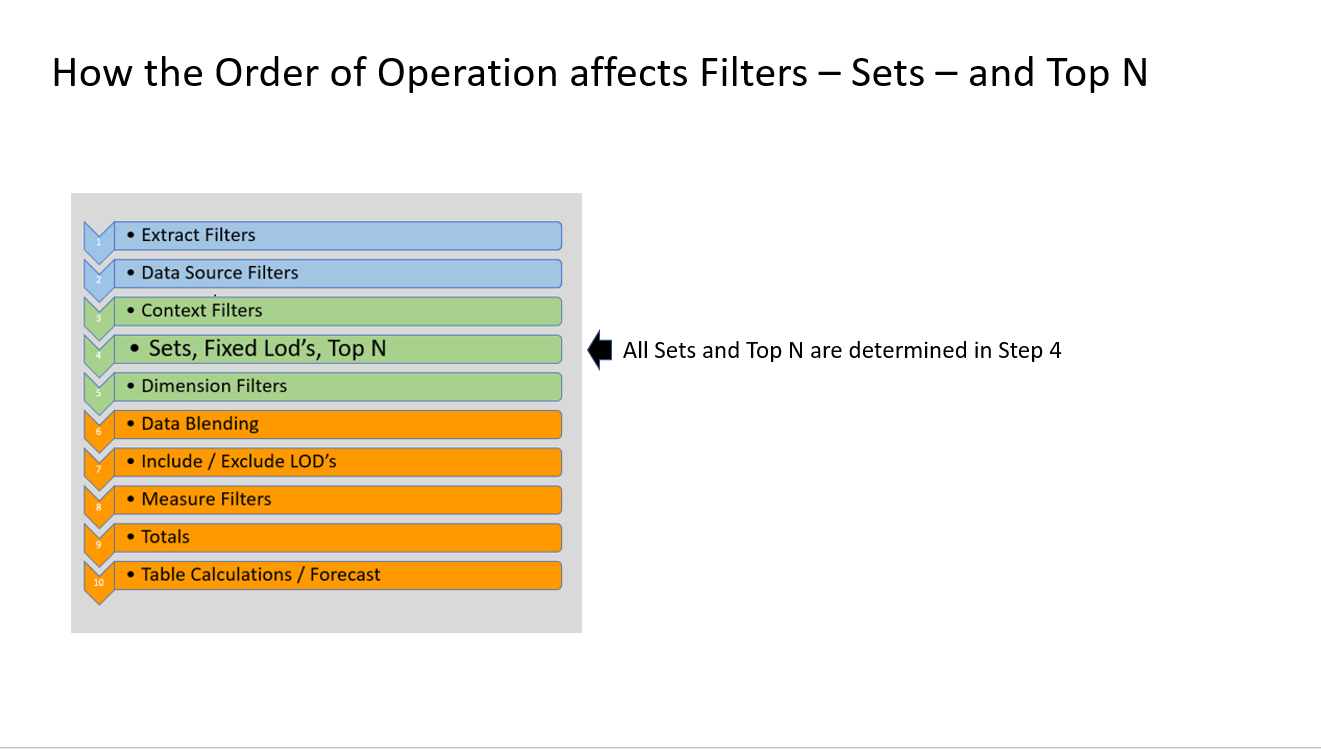
The Top N filter takes place in Step 4 in the Order of Operations along with the creation of Sets and Fixed LOD's expressions. That is after Context Filters but before Dimension filters are applied. It is also before any other type of calculations including Table Calculations are determined in steps 7 through 10 –
Example 2 – Top N Filter with Context Filter
We will start with a Superstore example to find the Top 7 States based on sales

With Region in Context, the filter will return in 7 states with the greatest sales from the regions in the view
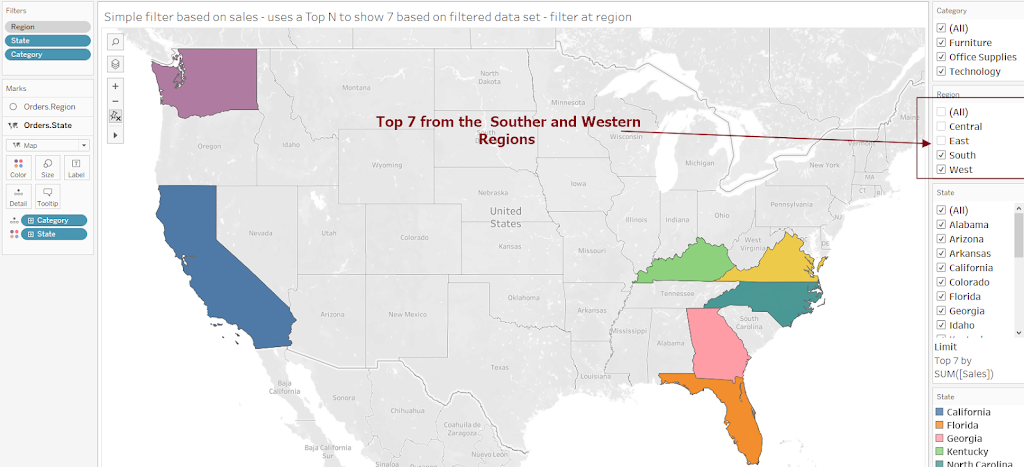
if Region is removed from Context the top 7 are determined before the Region filter is applied and

Example 3 – Multi Dimension Top N Sets
Now let's look at combining additional dimensions in the Top N. We still want the top 7 States but the users also wants the top 7 based on the total sales of selected subcategories –
First, we need a LOD to determine the sales at the combination of State and Subcategory
{ FIXED [Sub-Category],[State]:sum([Sales])}
Next create a set with this condition
sum({ FIXED [State],[Sub-Category]: sum([Sales])} )=
sum([3 LOD sales by subcat and state])
and add in the Category and subcategory Filter to Context – and the set will include the 7 states that have the max total sales based on the filter subcategories
when the subcategories are changed the Top 7 adjust :
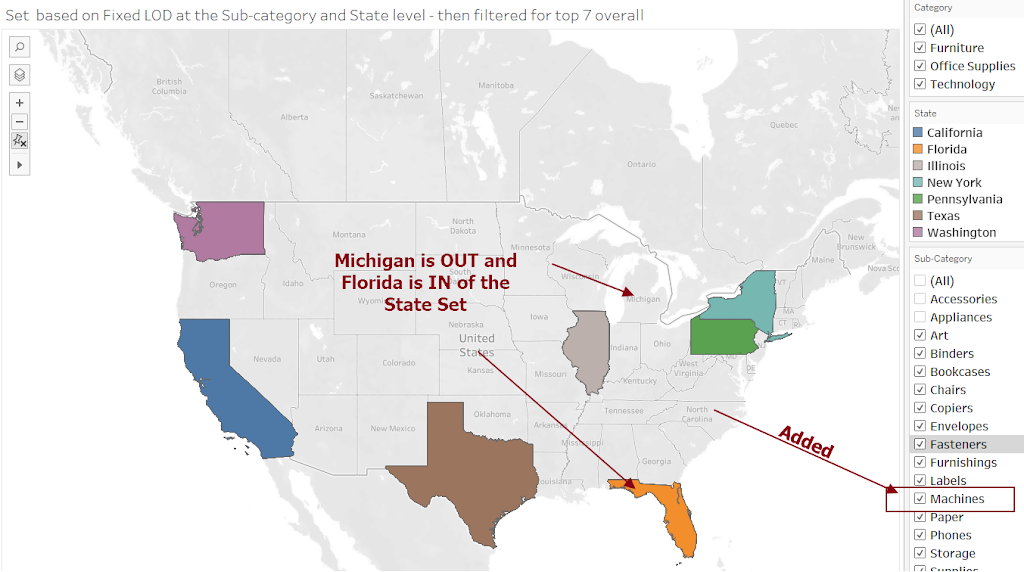
Example 4 – Fixed 7 States find the Top N subcategories
Users want to find the top categories within the 7 overall best States.
Now the Order of Operation and the use of Table Calculations come into play. First, we need to determine the top 7 states and then within each state find use Rank to order the subcategories –
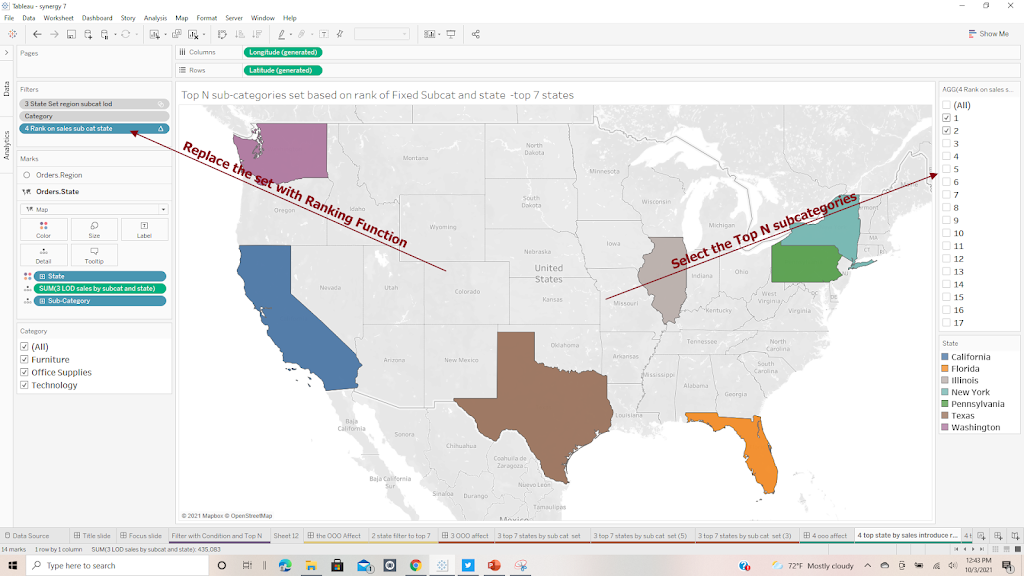
Ranking functions are table calculations that are determined in Step 10 of the OOO after the sets and lods are determined in Step 4. Using the LOD we calculated in the previous example
{ FIXED [Sub-Category],[State]:sum([Sales])}
add that to a Ranking function
RANK_UNIQUE(sum([3 LOD sales by subcat and state]),'desc')
and replace the set with the ranking function the number of categories to show
It is easier to see the result in a text table format
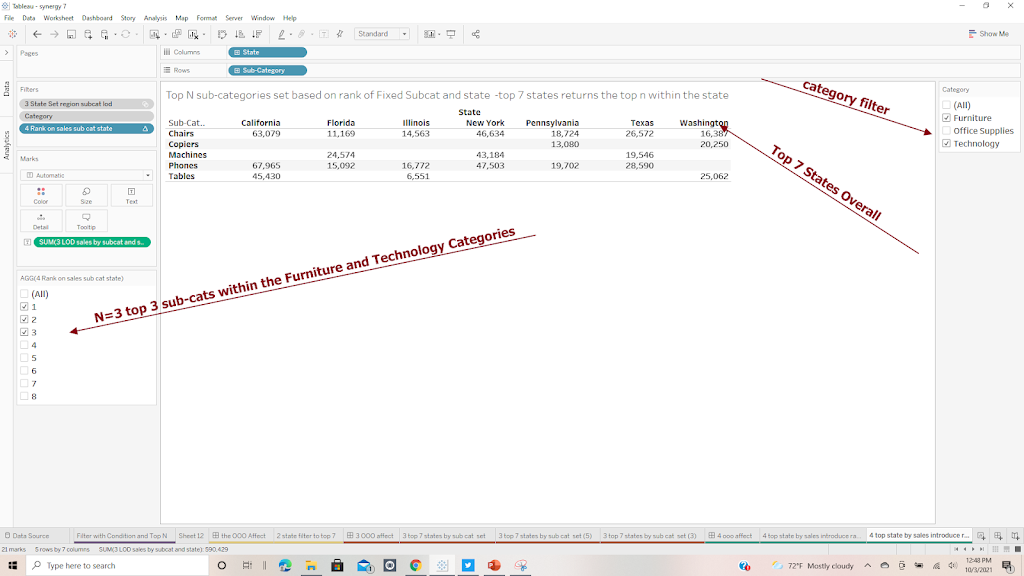
The top 7 States overall are first determined then the top 3 subcategories are identified in each state
Example 5 – the Reset Button
Ever have a dashboard where you've applied several filters and you would like to "Reset them" with a single click – It can be done with a "Reset Button" – No magic here just the creative use of an action filter
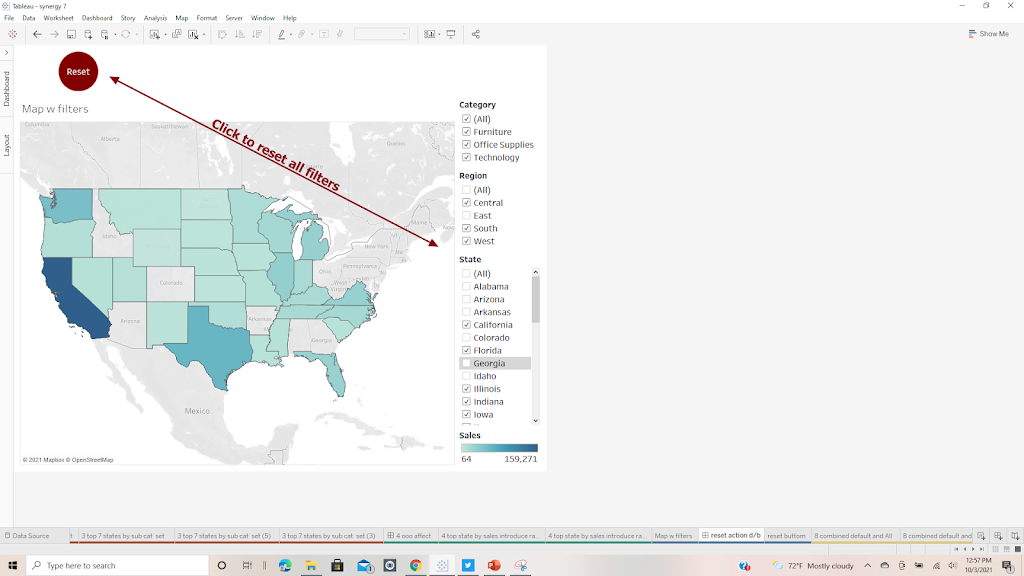
Create a worksheet with a shape and a label –
then on a dashboard add an Action Filter – from the Rest button to sheet where the filters are applied – the select each filter you want to reset – you will get a Warning Message but that is not a problem
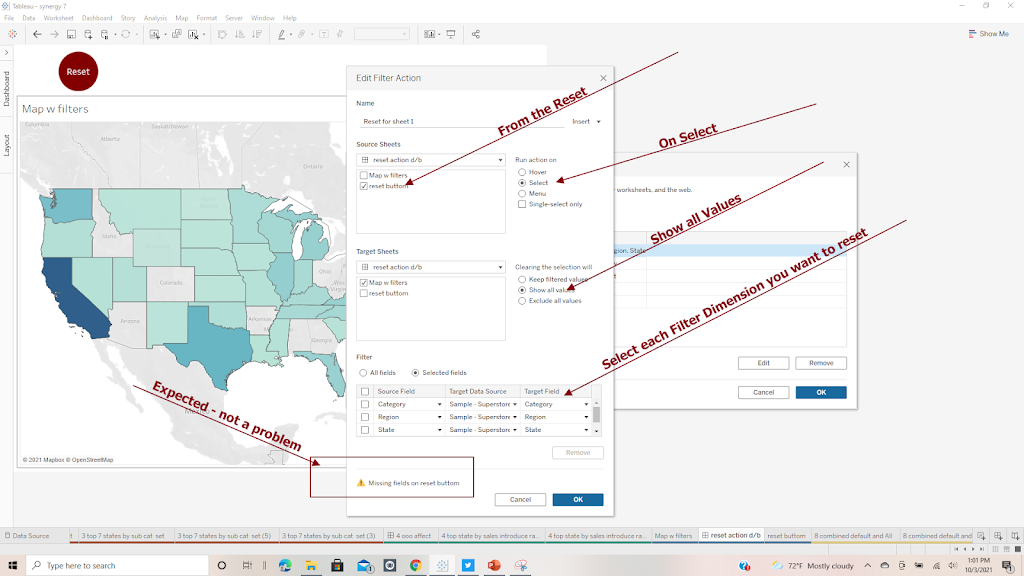
Select the rest button will return all values to the filters

Example 6 Default Values for filters
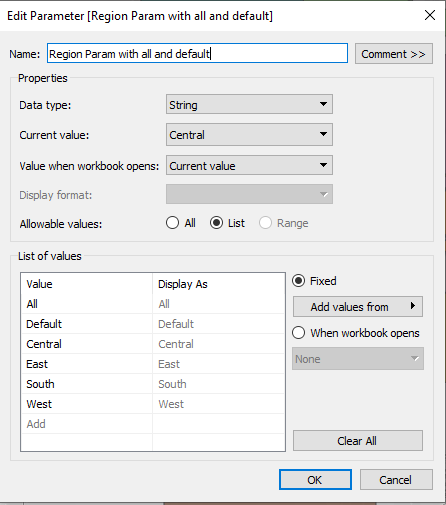
Some users want to set default values for filters and it can be done with some creativity using a parameter ( Credit for this goes to Joshua Milligan – Tableau Zen Master Hall of Fame – Link to Joshua's work ) It is done by first creating a parameter on Region and adding in 2 values – All and Default
Next, create a case statement for Default In this example there are 4 States we want for when the user selects Default – they are connected with OR
CASE [Region Param with all and default]
When "Default" then
[State] ="New York" or
[State] = "Illinois" or
[State]= "Florida" or
[State]= "Washington"
end
then we just need a TF filter
[Region Param with all and default] = "All" or
[Region]=[Region Param with all and default]
or CASE [Region Param with all and default]
when "Default" then [8 Default state from region]
end
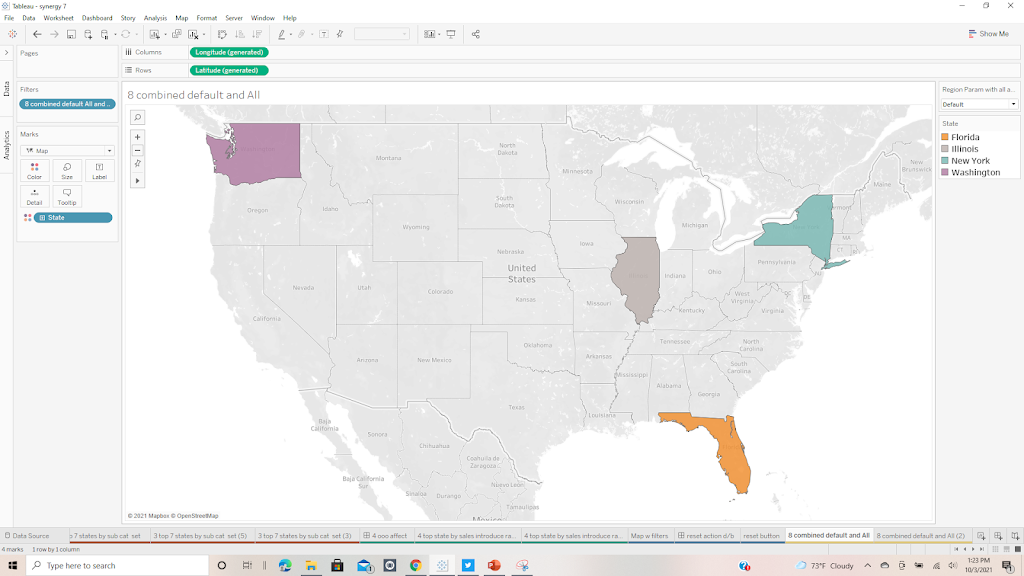
When All is selected in the Region parameter the statement returns a True. if the user selects and a single region just that region will return a True. When Default is selected the Default case statement returns a True for the 4 states and returns this
Example 7 Cascading Parameters
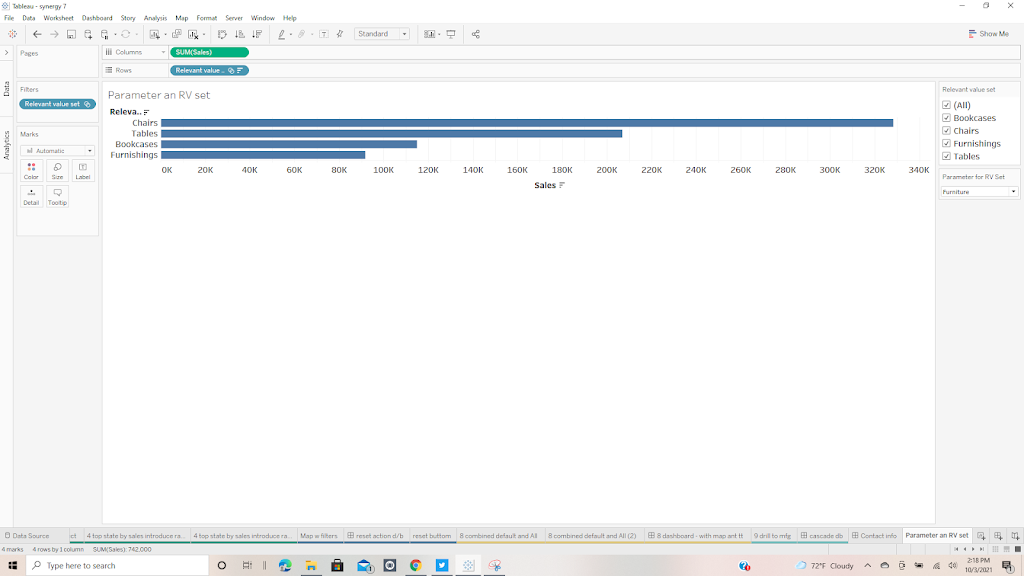
Frequently users want to have the drop-down values in one parameter be dependent on the value of another parameter. Currently, that is not capable in "out of the box Tableau" and I have responded to users to use a parameter and a "Relevant Value Filter or Set" on the Condition Tab like this:
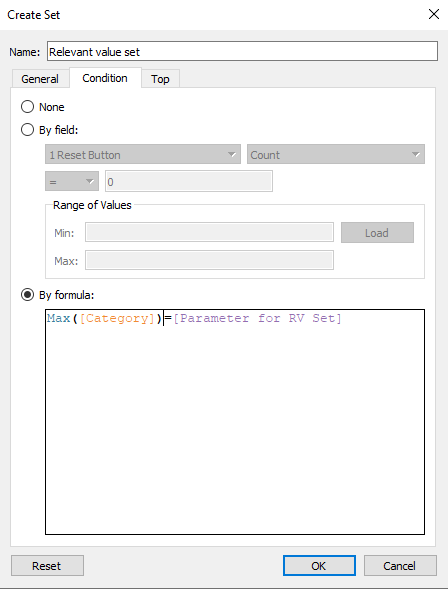
Which would create a set based on the parameter and only show the IN values in the set
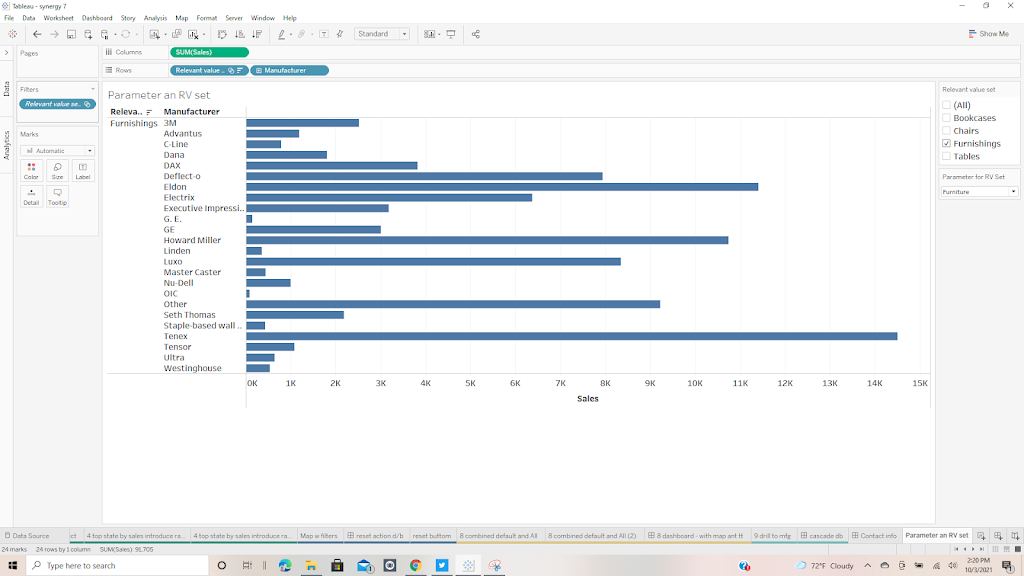
and from there you can use the set to drill down
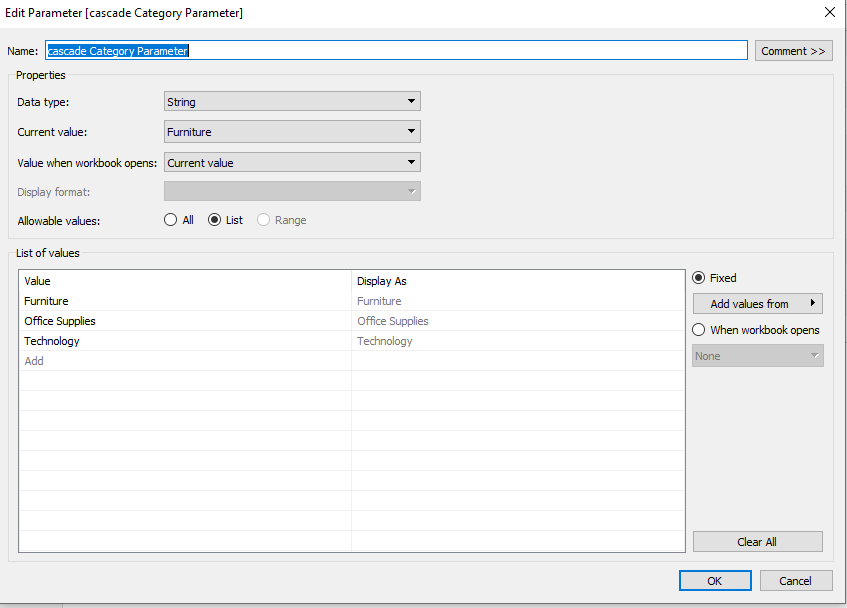
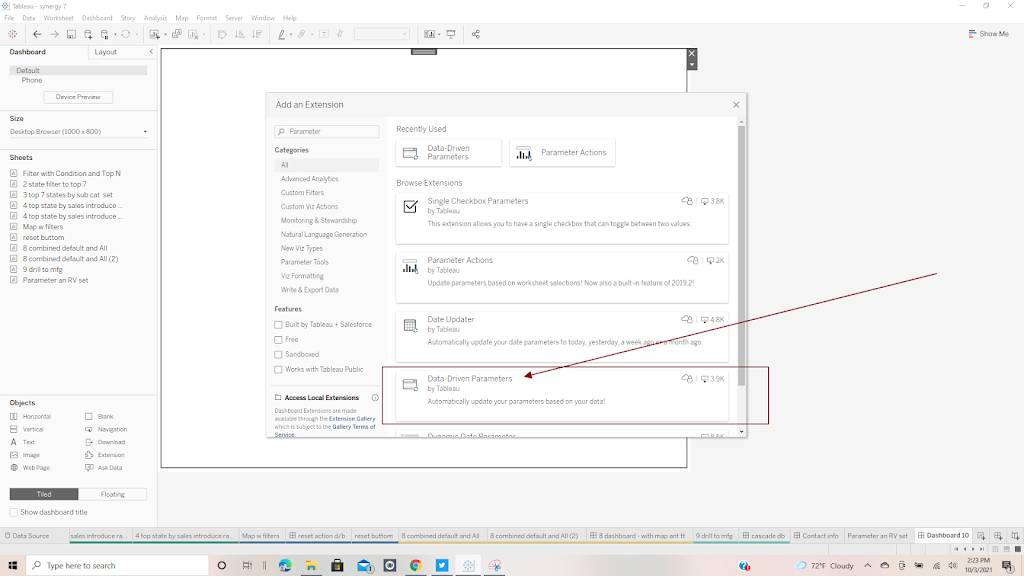
the extension needs to be configured – on the first page Identify the parameter that will accept the values (the second above), the worksheet it is on, and the dimension on that sheet that relates to the values ( here subcategory)
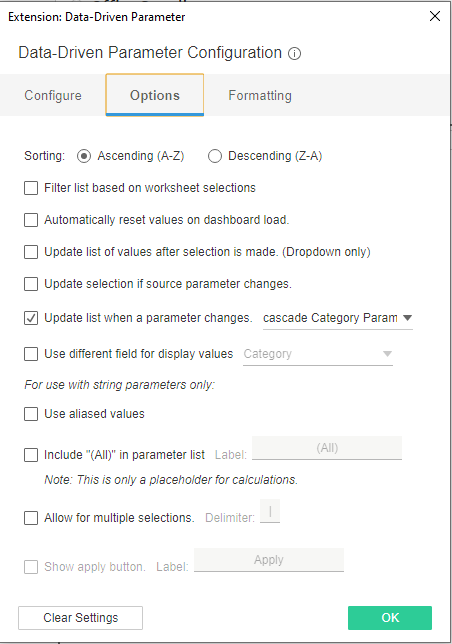
on the Option Tab select 'Update List when Parameter Changes' and the parameter that will drive the list (the 1st parameter – here Category Parameter)
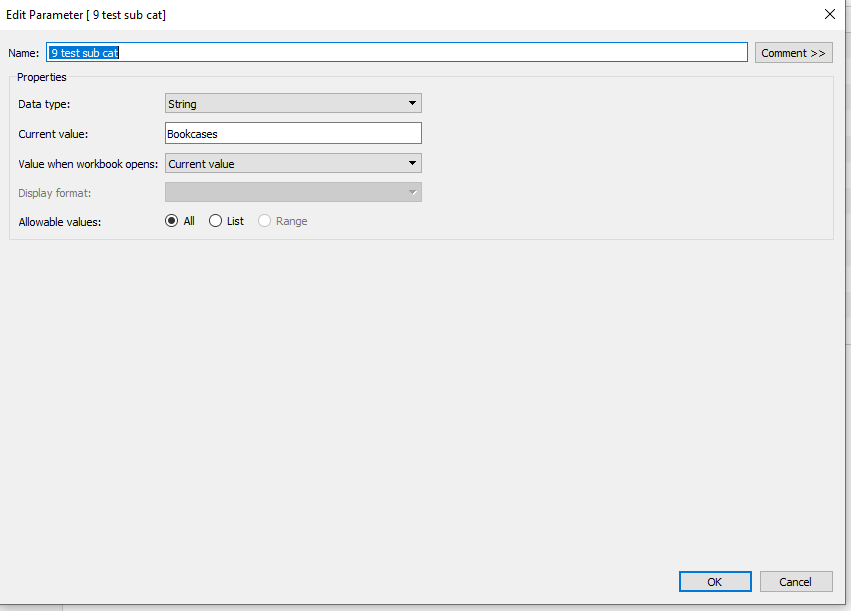
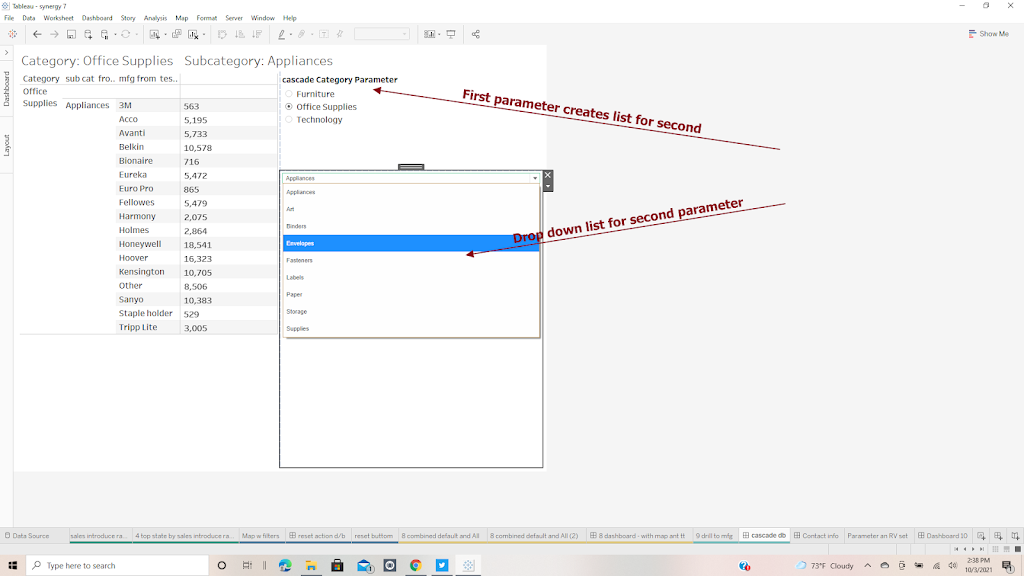
Then create the viz and the first parameter will drive the drop-down list in the second
I hope this help explain the use of the Condition and the Top N tabs and has given you some ideas on how you can use them in your vizes
The workbook used here can be found at Link to Workbook
Enjoy
Jim
