
Dynamically sort Top N in a Drill Down Hierarchy
Lately, the Forum has been peppered with questions about sorting, ranking, application of filters, and how to make the sort “Dynamic”. So I thought I would take some time to go through a few examples on how to sort in most situations
Let’s start at the beginning with examples to show how sorting works and how it will interact with the Order of Operations
Note: The post uses Superstore data – Sales at the Region and State level and Year of Order Date I also have a Top N State Parameter set to 5 –
Example #1 – Basic single level sort
A simple sort of Sales by State
A simple sort of Sales by State
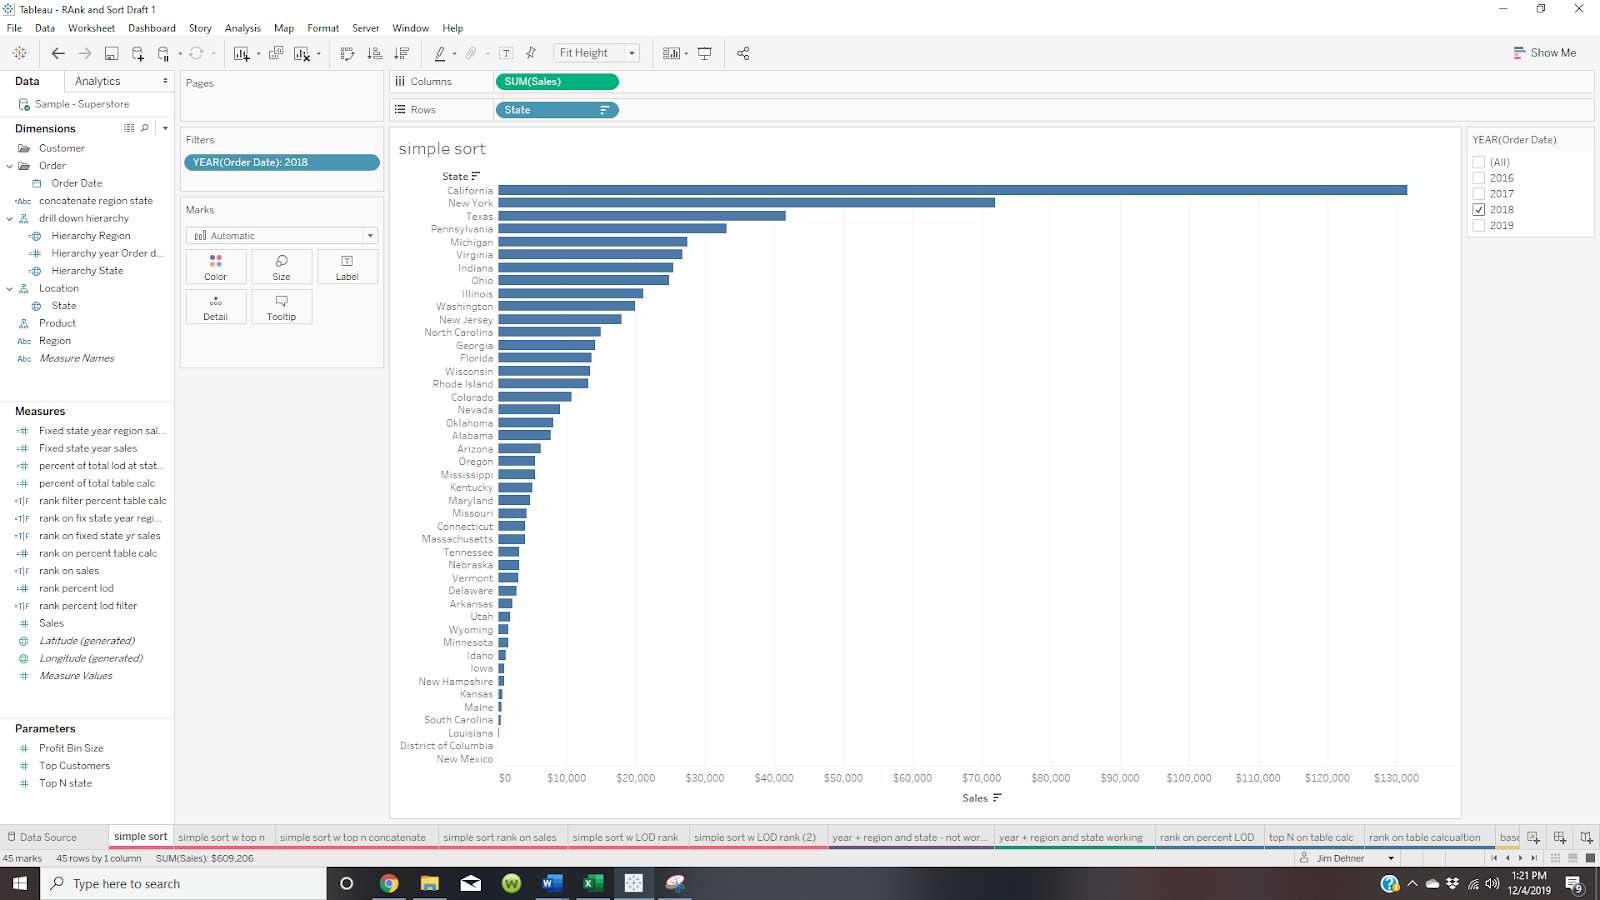
States are sorted on the sum(Sales) descending (max to min) – no problem
Example #2 – Nested Sort
Add Region and by using the sort Icon on Sales Tableau sort max to min within each region
Add Region and by using the sort Icon on Sales Tableau sort max to min within each region

Now let's add filtering
Example #3 – Top N filter
Example #3 – Top N filter
First, try to put in a Top N filter on State

But even with Region in the view Tableau returns 5 States not 5 States per region

A look at the Tableau Order of Operations shows why

Top N filters (the type applied on the Filter menu) are calculated after Context filter and in the same step as Fixed LOD expressions. Both precede Dimension and Measure filters
– the Top 5 States are determined before the Regions are applied – and Tableau returns the Top 5 States overall
What can you do?: –
Example #4 – Sort by Rank
Rank can be used in a filter
– This calculation ranks the sum of sales by the filtered dimensions in the view – max to min
– if the rank is less than the Top N State parameter (5) it returns a True
– if the rank is less than the Top N State parameter (5) it returns a True
RANK_UNIQUE(sum([Sales]),"desc")<=[Top N state]
Tell Tableau to determine the Rank by State

(Just my POV – I prefer Rank in one of its many forms – Rank works with any aggregation, LOD’s or can be nested with other Table Calculations)
Create the viz. Tableau returns this

Example #5 LOD sales and Rank filter
The same result could be used using a LOD on sales and rank on the LOD
The same result could be used using a LOD on sales and rank on the LOD
Fixed State Year Sales = { FIXED [State],year([Order Date]):sum([Sales])}
Add a filter Rank on Fixed State Year
RANK_UNIQUE(sum([Fixed state year region sales ]),'desc') <=[Top N state]
It returns the same viz

The advantage of using the LOD becomes apparent when the user wants to see the yearly breakdown – With Year(order date) in the LOD the viz will adjust to the filter present the rankings by year

Example #6 – Top 5 States by region by their percent to total sales within the region
By now I hope you know that using a Table Calculation and Top N filter on State will not return the result you want – but just in case
This is the formula for the Percent of Total table calculation
SUM([Sales]) / TOTAL(SUM([Sales]))
And when it is set to restart every Region and the state filter is set to Top N


By using the LOD Equivalent of the percent of total
SUM([Fixed state year region sales ]) / sum({ FIXED year([Order Date]),[Region]:sum([Sales])})
and a Rank Filter around the LOD
[rank percent lod]<=[Top N state]
The Viz would look like this
The solution can be extended to multiple years

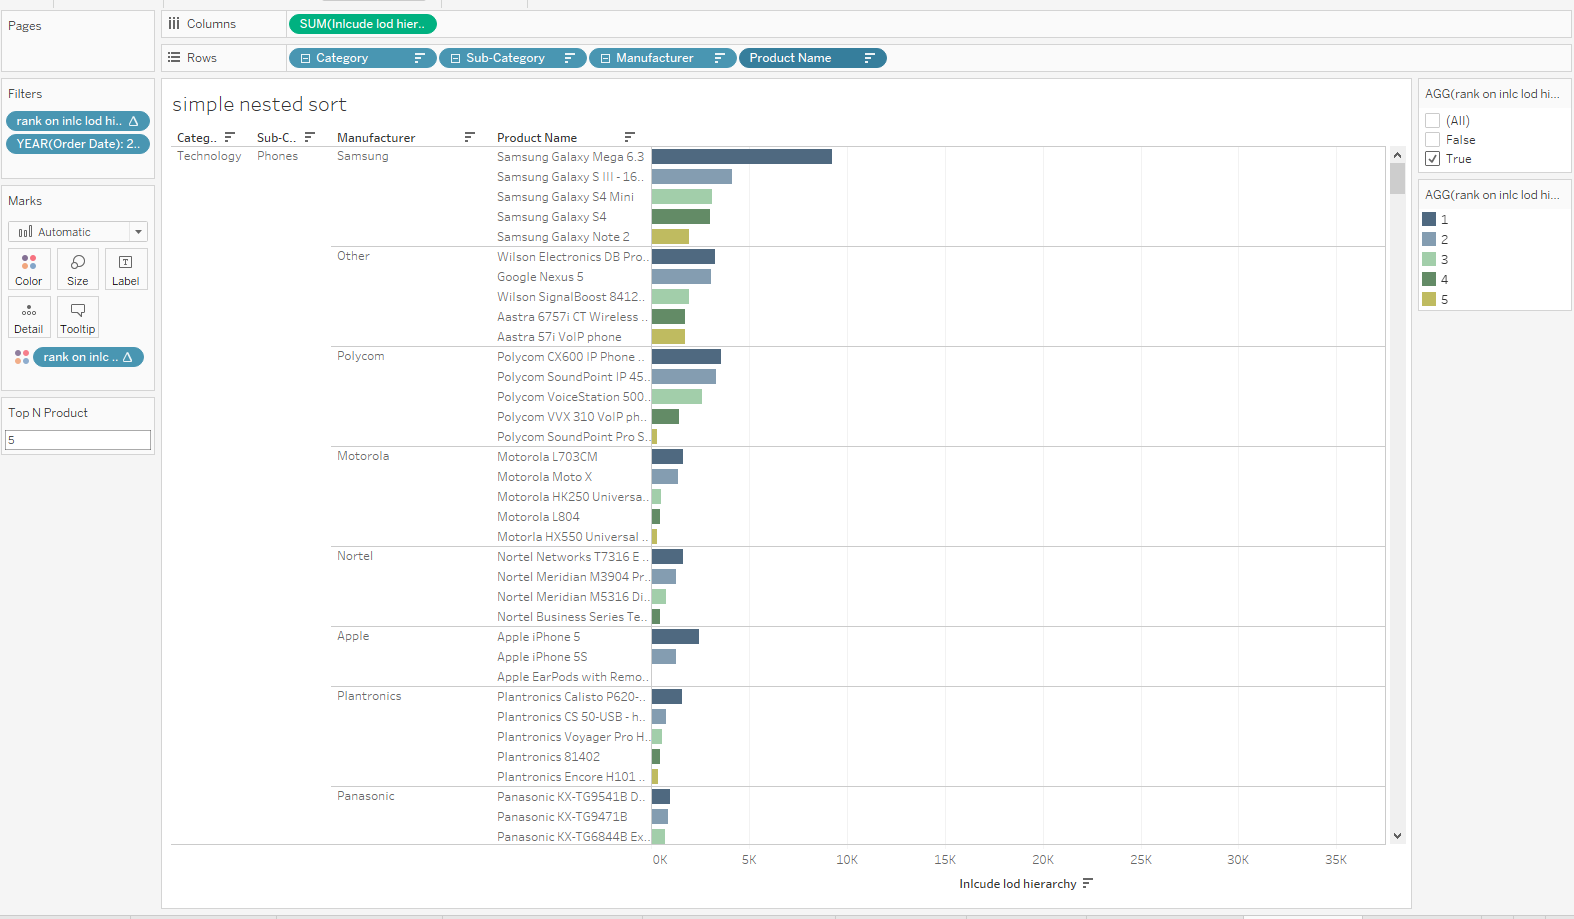
Example #7 – Sorting in a drill-down hierarchy
The example uses the Product Hierarchy from Superstore
Category→Subcategory→Manufacturer→Product Name
The LOD to calculate sales within the hierarchy uses the Include form of the LOD
{ INCLUDE [Product Name]:sum([Sales])}
And the Ranking filter is (Note I added a Top N Product parameter)
RANK_UNIQUE(sum([Inlcude lod hierarchy]),'desc') <= [Top N Product]
I also added a color code based on the Rank
Create the viz drag the hierarchy to Rows and fully extend it to Product Name
Set the hierarchy members to sort descending
- Open the Pill and select Sort and set to Nested – Descending
- Sort on Sales use the LOD as the formula
- Repeat the same at each of the other levels in the hierarchy
Set the two Rank table calculations to calculate Pane Across

At the highest level in the hierarchy, there are only 3 categories in the view

Expanded to the lowest level – Each level will have a max of 5 (top N Product =5) values sorted max to min
Example #8 Drill-Down hierarchy including date
I spent a lot of years as a product manager in consumer products companies – One question that came up around the end of the year was which state contributed the most to sales and how had that changed in recent years
For the example, I created a separate hierarchy
Region→ Year(Order Date)→State – Wait – Order Date between Region and State??
Yes, you can create a hierarchy on dimensions that seem counterintuitive and use it in the drill-down-

The formula for order date is simply
Year(Order Date)
The LOD used to aggregate sales is
{ INCLUDE [State],year([Order Date]),[Region]:sum([Sales])}
And the rank filter is just
RANK_UNIQUE(sum([Fixed state year region sales ]),'desc') <=[Top N state]
Create viz – Drag the Hierarchy to Columns and set the filter to True

At the year level results are sequenced by Year within Region

Drill down to State and the Top 5 States are ranked by Region and Year

The workbook containing the examples can be downloaded from my Tableau Public site at
Hope you now understand sorting and you are ready to take your viz to the next level
Jim
