
Logical functions like If/Then , Cases, And/Or or In statements are a fundamental part of creating customer vizzes – and they are not that hard to understand and use. Here we will look at what each statement does, its syntax, and some use-case examples
See the video Link to YouTube
1 If/Then statements
Conditional statements all work in pretty much the same fashion – there is an "If" clause that is a test condition – when the condition returns a "True" the "Then" clause is performed and returns a value before Tableau moves on the next record.
In its simplest form, the syntax might look like this
If [Category] = "Furniture" then [Sales] else 0 end
The test clause looks at the dimension Category in each record – when the value is Furniture the "Then" clause sums the sales – for any record where the Category is not Furniture the statement returns a 0.
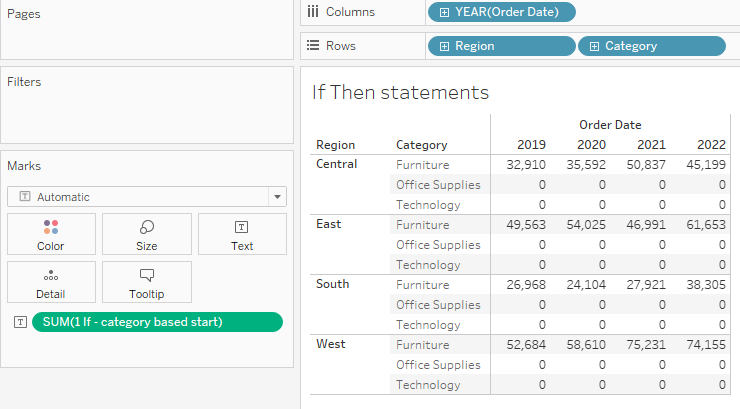
A couple of important points to consider – the statement is executed at the record level and looks for an exact (literal) match to Furniture – furniture, furn, or FURNITURE will not match. Also, the record only passes through the expression once – as soon as a Then (or Else) clause is executed Tableau returns a value and moves on to the next record (more on that later) – It is the same way spreadsheet calculators and other systems process conditional statements.
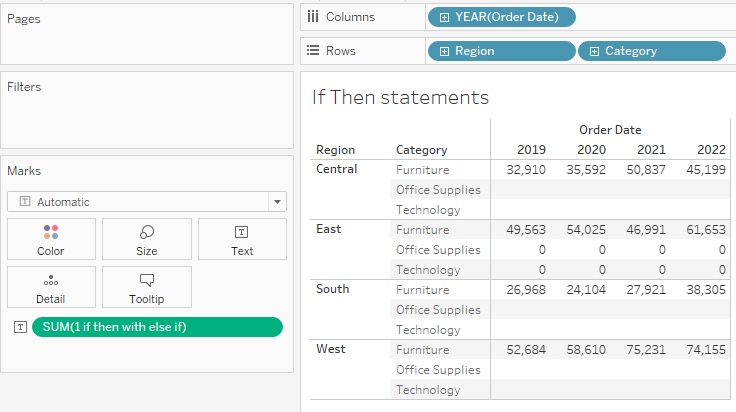
If/Then statements can have more multiple test levels – as an example :
if [Category] = "Furniture" then [Sales]
elseif Region = "East" then 1
end
Here the statement has 2 test conditions – one on Category and the Other on Region.
As a record passes through the statement it is first tested against the Category ="Furniture" test – if that is True Tableau returns the Sales and moves on to the next record – the second clause Region = "East" is not evaluated. On the other hand, if the record has a Category that is not equal to "Furniture" it returns a False and moves to the second test where Region = "East" is tested. If that is True Tableau will return a 0 – if both tests fail (return False) a null is returned.
So far we have looked a using if then with categorical data (dimensions) but they can also be used with numerical values (measures). Here one is used to group records based on total sales
if sum([Sales]) < 10000 then "Less than 10K"
elseif sum([Sales]) < 20000 then "10K – 20K"
elseif sum([Sales]) < 30000 then "20K – 30K"
elseif sum([Sales]) < 40000 then "30K – 40K"
else "Greater than 40 K"
end
The statement creates groups based on 10K increments in total sales and applies a text label to the group. When testing multiple levels it is very important that the IF clauses (the Tests) follow a continuous sequence – Low to high or high to low doesn't matter but the sequence can not be mixed.
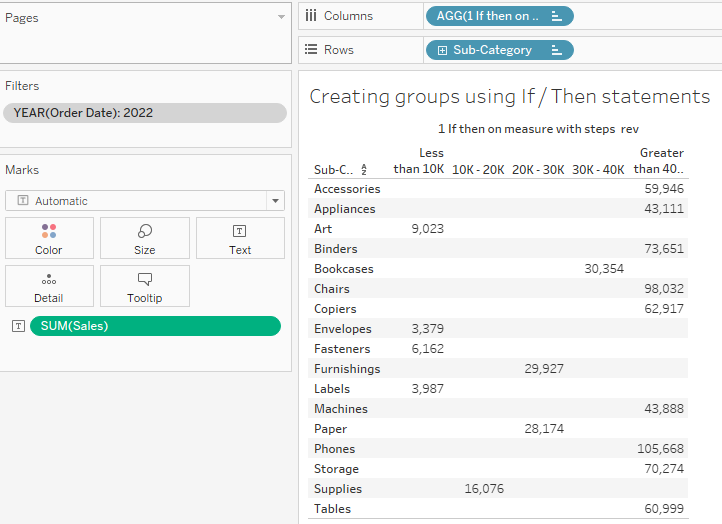
Note that it is not necessary, and more efficient to do a "one-side" test – the first clause will catch all records with sales of 10k or less so there is no need to recheck the low end of the range in the second test – simply testing the high range (less than 20K) is sufficient. The first and subsequent tests are connected with the key work Elseif (not Else if will not work). The final Else tells Tableau "this is what you do with any record that hasn't previously matched". It is followed by an END to finish the statement
2 Case Statements
Case statements are another conditional statement but only check for equalities – i.e. not inequalities like greater than or less than.
In this simple example, a Case statement is used to create 2 groups based on Region – the East and West regions are to be grouped as Costal and the remaining regions (South and Central) are Middle
CASE [Region]
When "East" then "Costal"
When "West" then "Costal"
else "Middle"
end
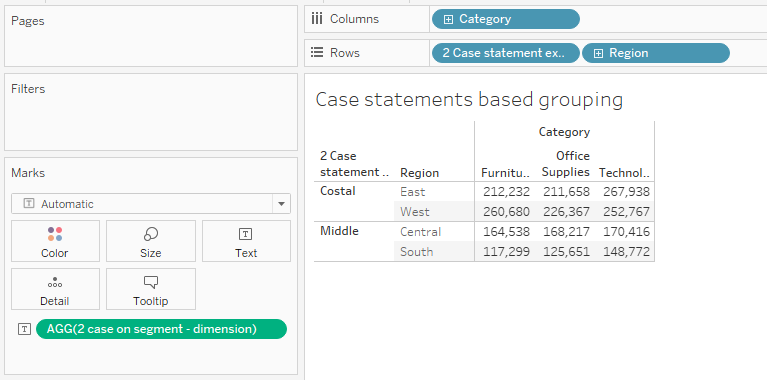
The syntax is to first state the dimension used in the test condition – here Region – then each "Test" is a separate When clause where Tableau will return a True on an exact match to a region value and execute the Then clause. Each value is tested independently. After the explicit conditions have been tested any remaining values are grouped with an Else clause and End closes the statement.
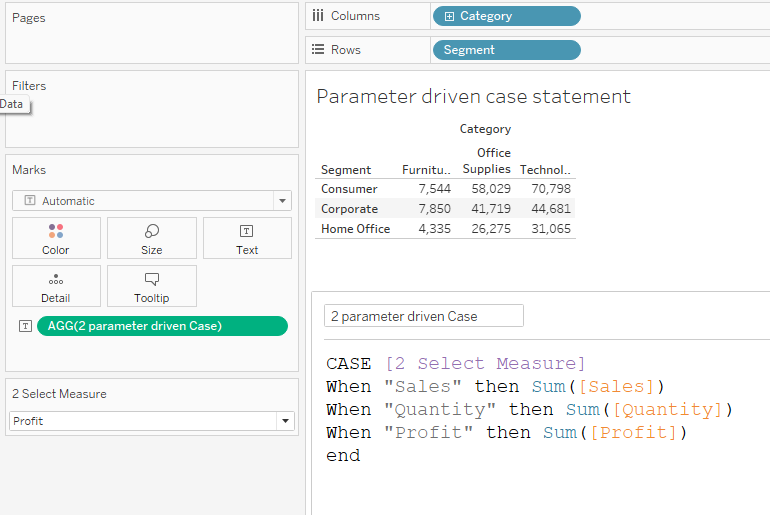
Case statements can also be used with a parameter to branch between different measures to display
Here the user selects a measure from a parameter and the case statement is used to show either Sales, Quantity, or Profit in the Viz:
CASE [2 Select Measure]
When "Sales" then Sum([Sales])
When "Quantity" then Sum([Quantity])
When "Profit" then Sum([Profit])
end
Because Case statements are based on matching specific values (equalities) they are not well suited to creating bins or groups based on a range of values – If/Then statements would be preferred.
3 In Statements
In statements will return a True when a test value is found in a coded list or a set –
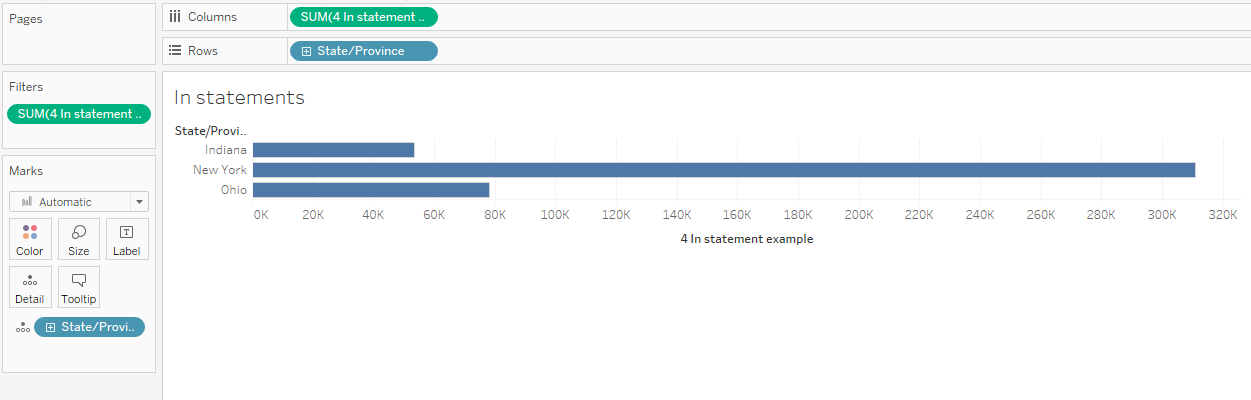
This statement will return a True if the State name is found in the list: "Ohio", "Indiana", "New York"
[State/Province] in ("Ohio", "Indiana", "New York" )
The In statement can be used as a filter or as a test condition in an If/Then statement.
if [State/Province] in ("Ohio", "Indiana", "New York" ) then [Sales] end
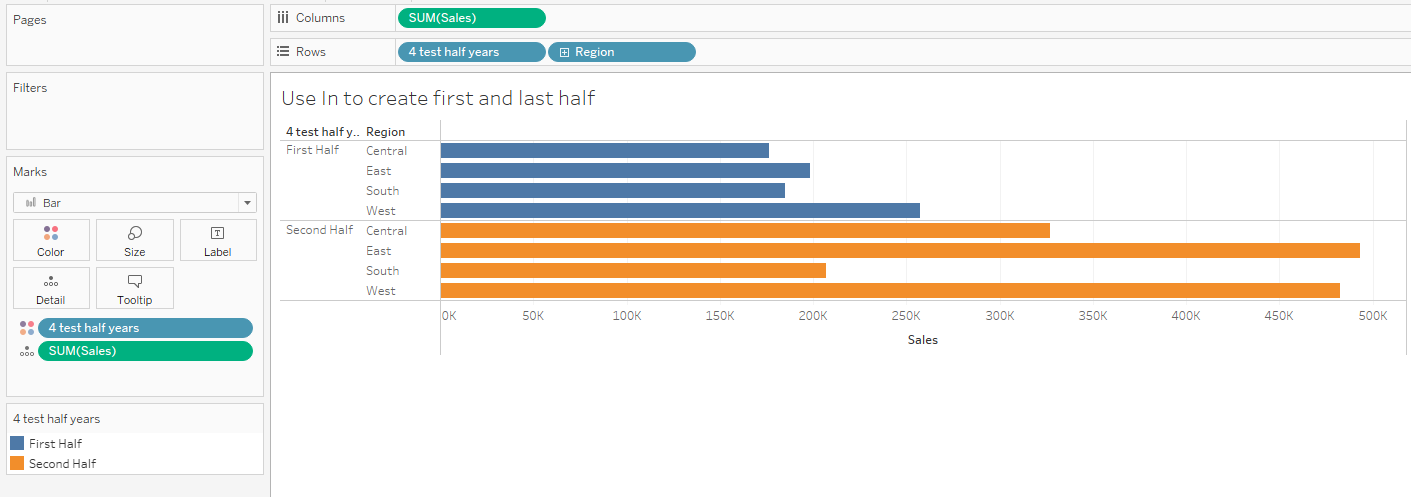
Or used to separate or group values as in
CASE MONTH([Order Date])
when in (1,2,3,4,5,6) then "First Half"
when in (7,8,9,10,11,12) then "Second Half" end
which can be used to compare totals in half-year increments.
The function NOT can be used with In as shown below
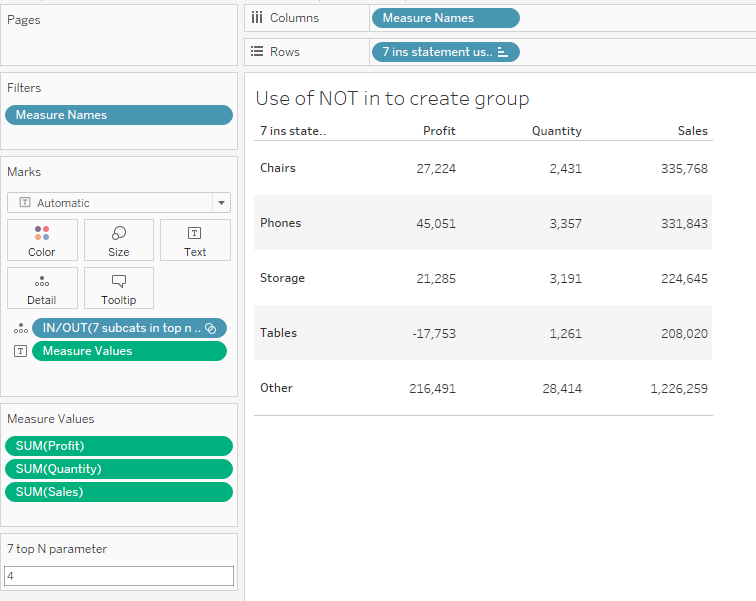
Here I created a Subcategory Set based on the Top N set by a parameter:
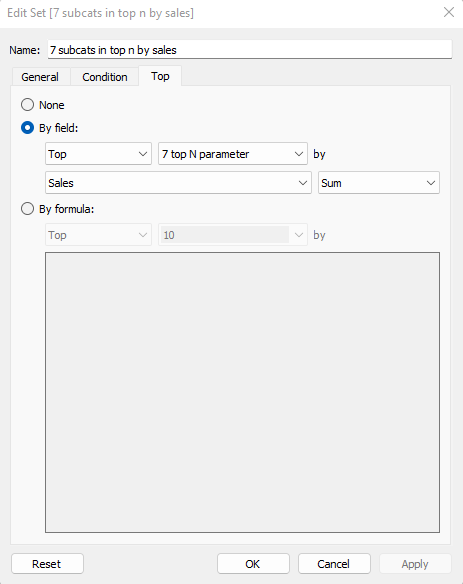
The expression will find the Subcategories that are outside the top N and rename them "Other"
If Not [Sub-Category] IN [7 subcats in top n by sales] then "Other"
else [Sub-Category] end
Note the Not is placed outside the dimension used to define the Set.
If/Then, Case, and In formulas are the three basic conditional statements used to group and collect dimensions or measures – and they can be used individually or in combinations by using two additional functions AND and OR
– See the examples below
4 Examples
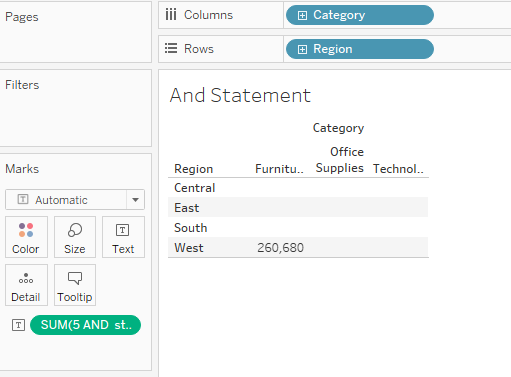
1 Simple AND vs Or connections
This first calculation will return sales only when both conditions are met
if [Category]="Furniture" AND Year([Order Date])=2022 then [Sales] end
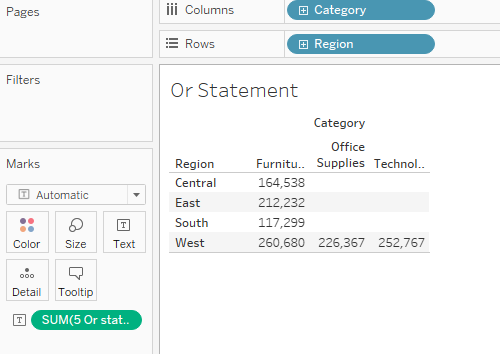
by contrast, the second will return the sales when the Category or the year is 2022 –
if [Category]="Furniture" OR Year([Order Date])=2022 then [Sales] end
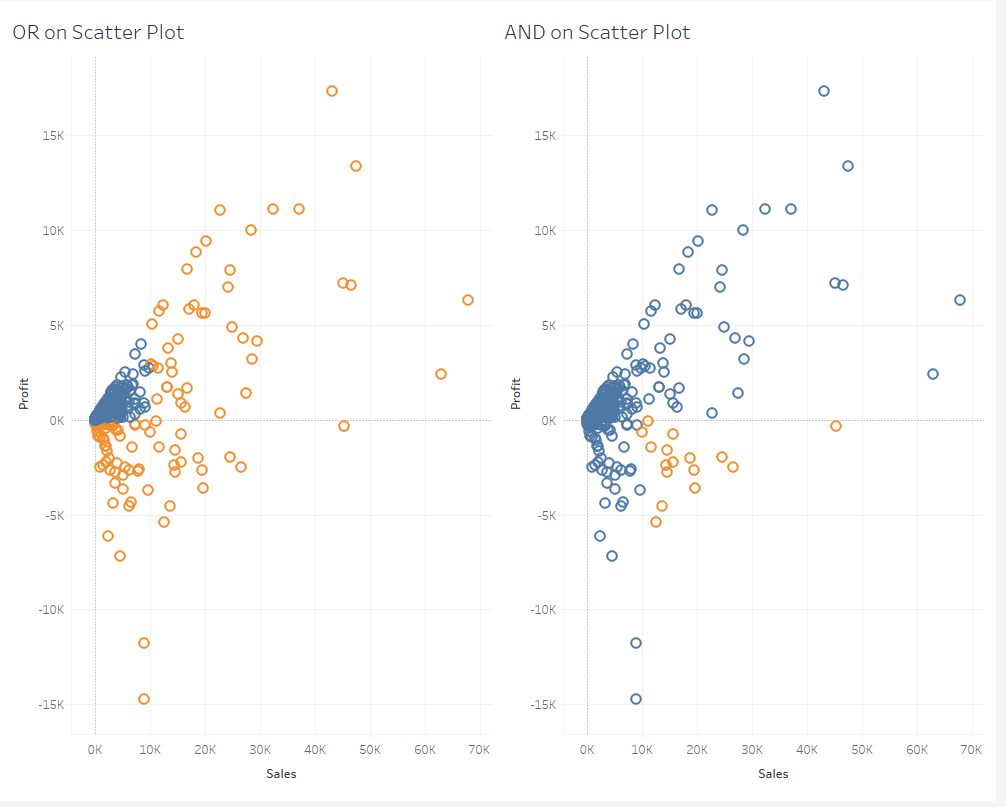
Example 2 using a condition to create a Boolean
Using a conditional test without the IF / Then results in a Boolean – a True or False. Booleans can be used in filters or as parts of other calculations
This statement will return a True only when both the Sales total is greater than 10K and the Profit is negative
sum([Sales])> 10000 AND sum([Profit]) <0
This one uses the OR conjunction to test if either condition is met
sum([Sales])> 10000 OR sum([Profit]) <0
the comparison of the AND option v the Or can be seen in the scatter plot below
Example 3 Use of conditions in LODs
Conditions can be used in either the dimension list or as part of the aggregation function in LODs
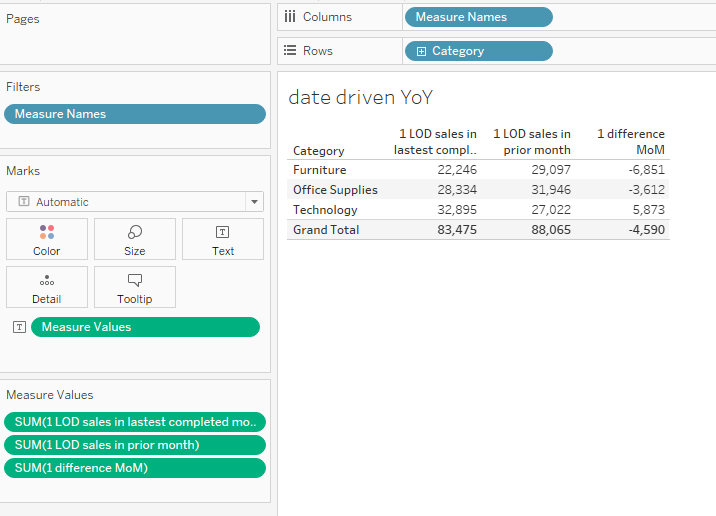
This calculation will return the total Sales for the most recently completed month (that is the month prior to today's date) – note the IF/Then condition is placed after the colon : in the aggregation expression –
{ FIXED [Category]:sum( if DATETRUNC('month',dateadd('month',-1,today())) = DATETRUNC('month',[Order Date]) then [Sales] end)}
Adding a similar expression and then taking the difference results in a YoY analysis
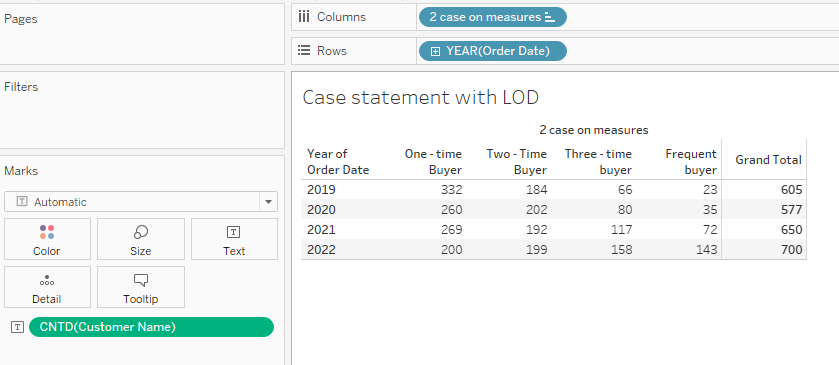
On the contrary, this expression places the Year of Order date in the dimension list to group customers by annual order count
CASE { FIXED [Customer Name],year([Order Date]): countd([Order ID])}
when 1 then "One-time Buyer"
When 2 then "Two-Time Buyer"
When 3 then "Three-time Buyer"
else "Frequent Buyer"
end
Example 4 Using a condition in a Table Calculation
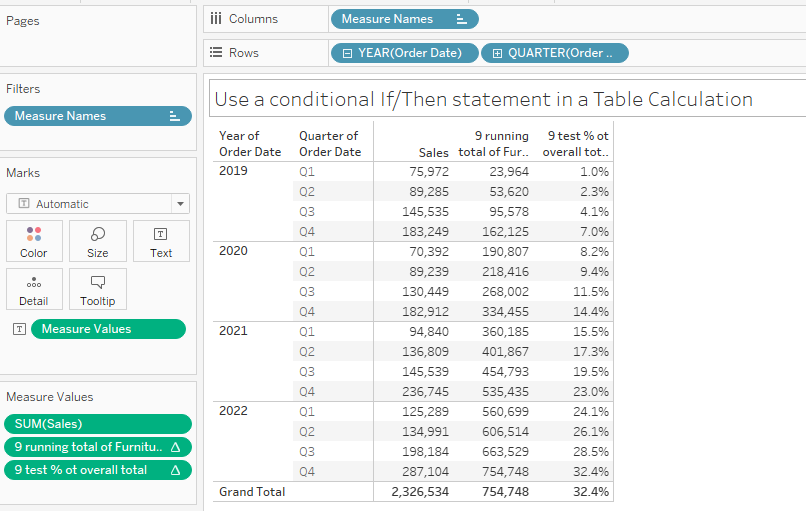
Conditions can be embedded in table calculations. If you needed to find the percentage of total overall sales based on the running sales in the Furniture category only you could start with:
Window_sum(sum(if [Category]="Furniture" then [Sales] end ),first(),0)
Here I used Window_sum starting with the first cell through the current cell for the running total. Note the condition Category="Furniture" is embedded in the table calculation (not outside).
To calculate the percentage to the total of all sales for all periods you could use this:
window_sum( sum( if [Category]="Furniture" then [Sales] end ),FIRST(),0) / window_sum(sum([Sales]))
Where the denominator is another table calculation that looks at the window_sum of all sales regardless of category or period
It would look something like this in a text chart:
Example 5 Mixing LOD's Table Calculations and IN statement to find the Top N by Region
Here the goal is to plot the Top N subcategories by region and group the remaining subcategories into Other – Each Region is independent.
Start with a LOD at the region/subcategory level
{ FIXED [Region],[Sub-Category]:sum([Sales])}
Next, create a Set based on the LOD
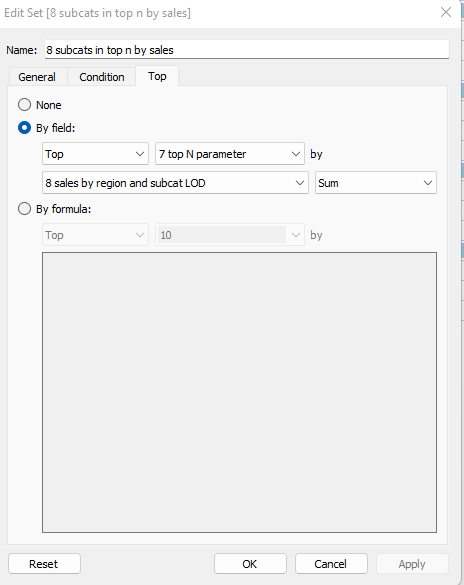
Then use the Set in a NOT IN statement to group the "Other"
If Not [Sub-Category] IN [8 subcats in top n by sales] then "Other" else [Sub-Category] end
and plot the results and use this T/F filter to plot the Top N and also the Other Group
[8 rank subcat by region]<=[7 top N parameter]
OR attr([8 ins statement using set to create other])= "Other"
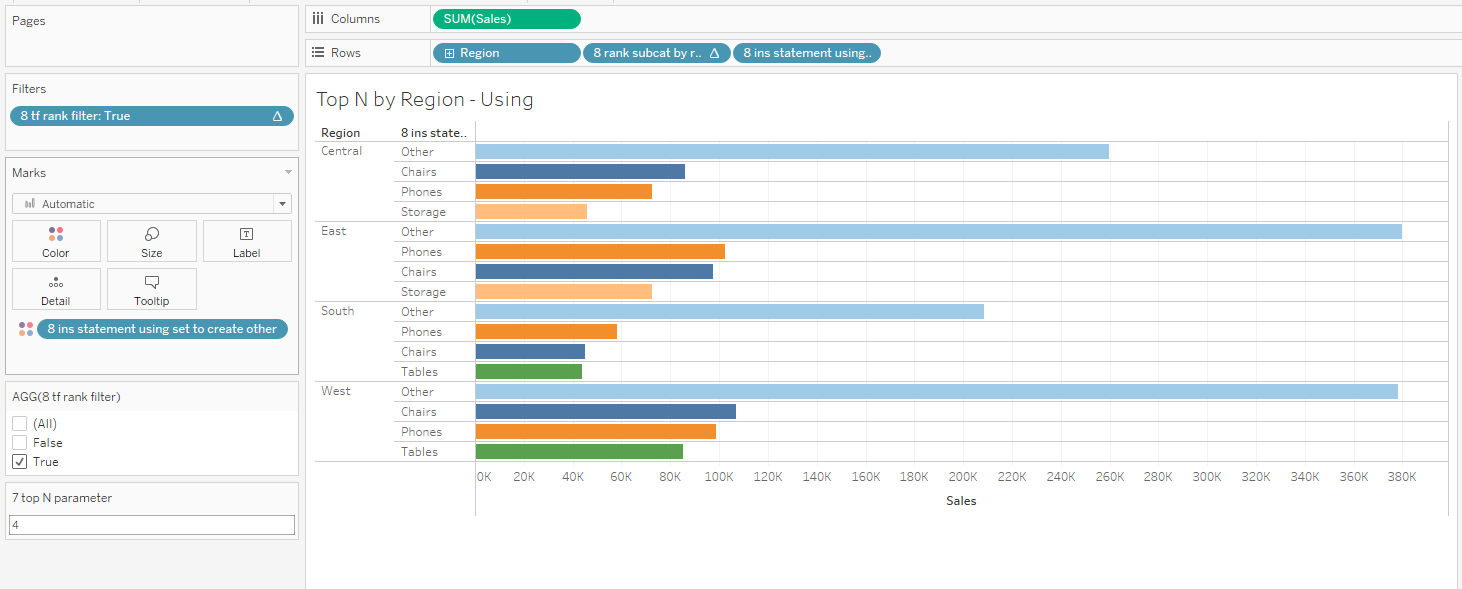
(Frequent followers will note this approach is much easier than the nested table calculations I have recommended in the past – It is how I will be doing Top N and Other in the future)
Now it is your turn. Practice using logical functions separately or in combinations –
The workbook with the examples used here can be found at Link to Workbook
Enjoy
Jim
