
For new and more advanced users, alike Parameters are misunderstood and misapplied!
Parameters are a function that allows the user to manually input a single value into a Tableau workbook. Not that difficult –
Manual input – not based on a calculation or another field – the value can be any data type – Dates, Numbers, Strings, or Boolean – and can be selected from a dropdown, keyed in, or set using a parameter action
Single – one value – not multiples
That said – parameter values don't do anything – they are just values that can be used in calculations or filters and it is those calculations or filters that do the work.
There are a couple more important characteristics of parameters:
They are Global – the value is the same throughout the entire workbook
They are Static – only change when manually changed by the user – when changed all the calculations or filters which use the parameter value change at once
They are changed manually (Yes I know I mentioned that a couple of times already but it is important) – they can not be made dependent on one another or other calculations in the workbook.
Parameter Drop-Down list and initial values can be changed "dynamically" when the workbook is opened (or refreshed)
Using a parameter takes 3 steps:
- Create the Parameter
- Use the Parameter in a filter or calculation
- Create a way to change the value by placing it on the worksheet or using a value picker tied to a parameter action
See the video Link to YouTube parameters
1 – Create the Parameter
Either manually or directly from dimension(s).
Manually select "Create Parameter"
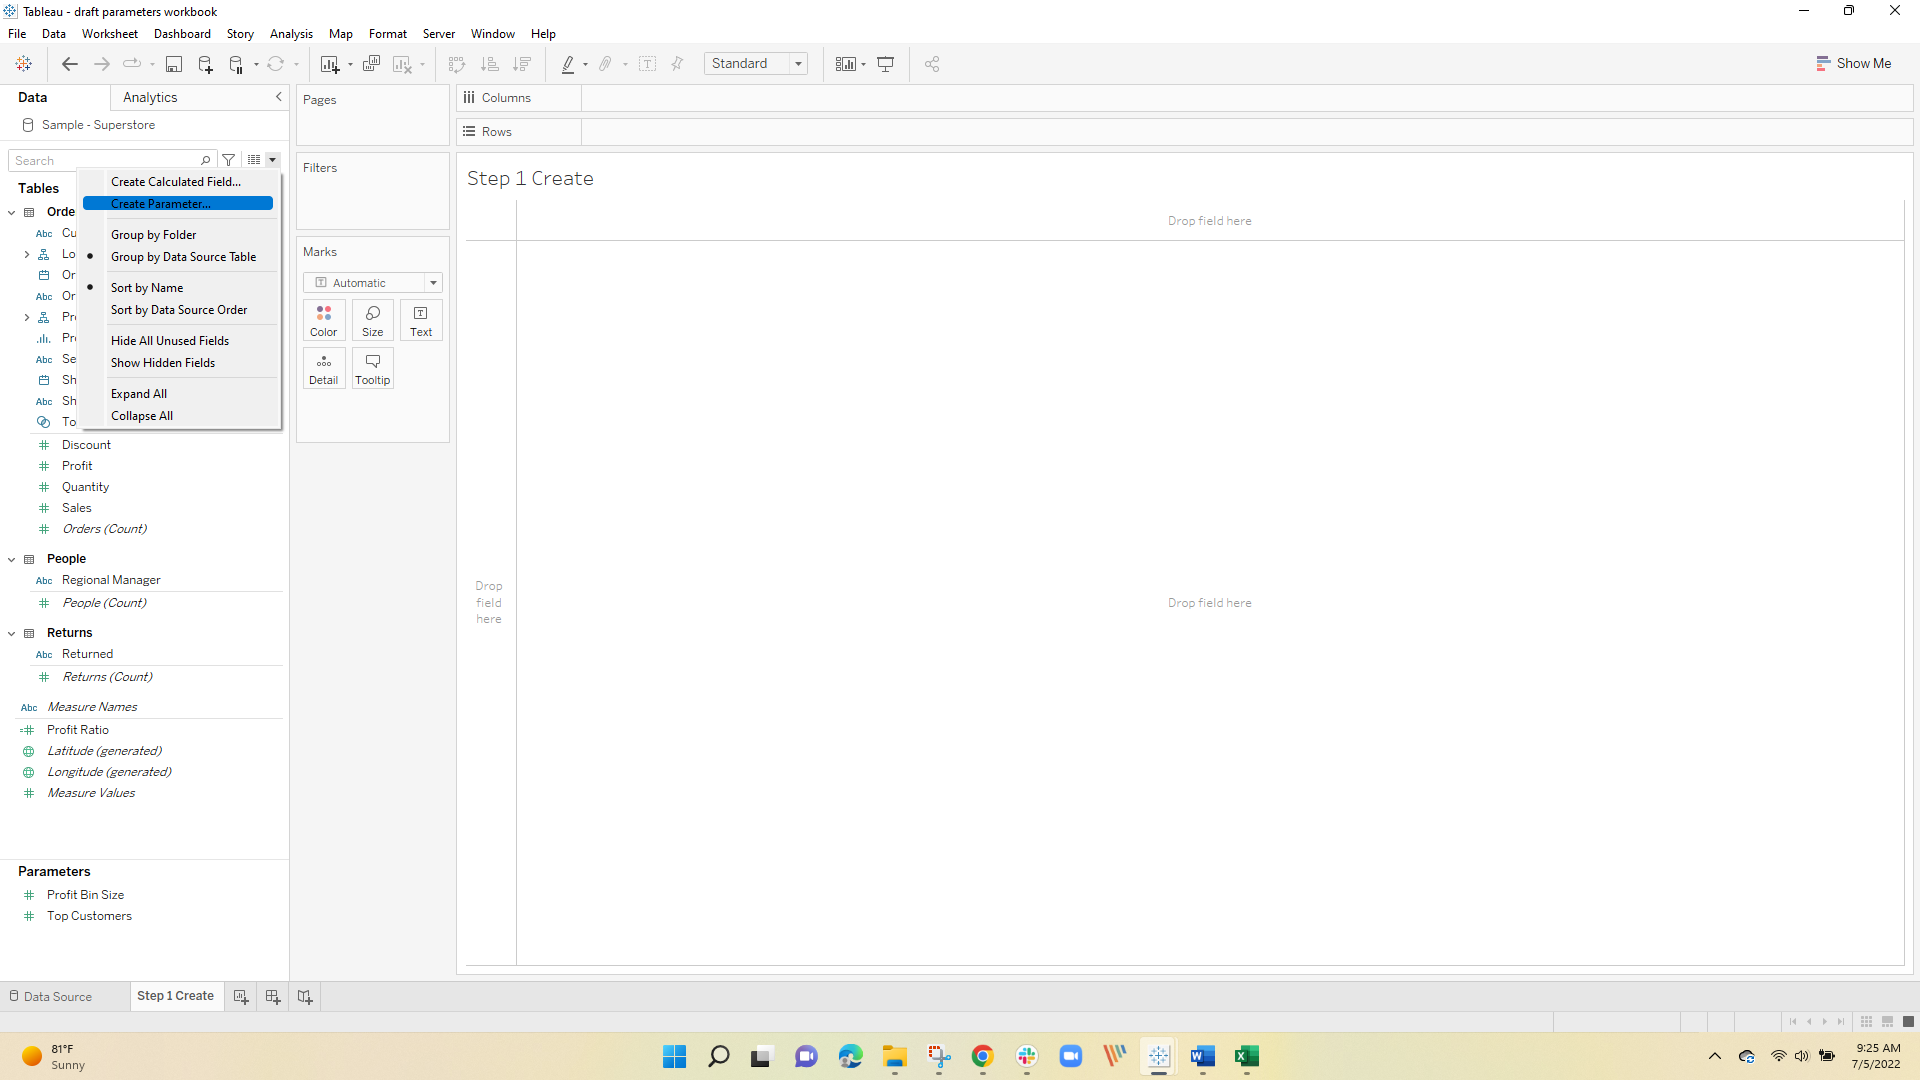
and a widow will open
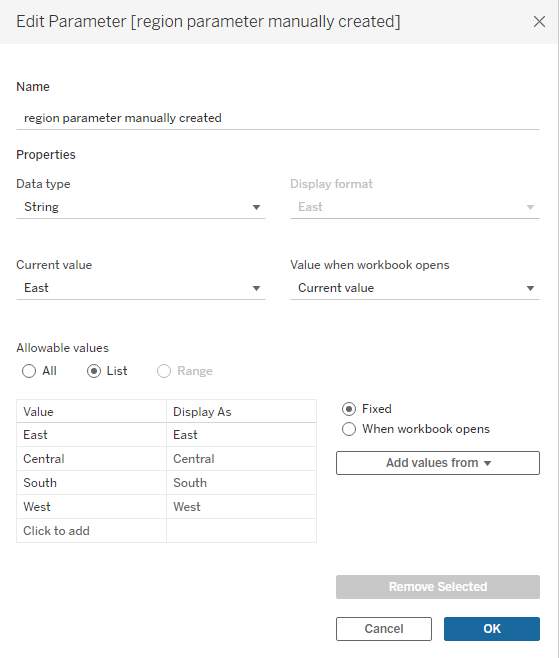
you have a choice of data types – here String – and then select "List" and type in the values you want – the "Display As" is what the user will see and the "Value" is what you will use in your calculation or filter – it is Data Type sensitive but does not need to match the display values –
when using string values I like to use words that relate to the analysis so when I revisit the workbook at a later date I can easily see how the calculation works.
Parameters can also be directly created from a Dimension – select any dimension (right-click) and select "Create Parameter"

And the parameter values will load directly from the data in your data set – data type will be set to match and note – a date parameter will load a list of each date – remember parameters are single-valued and the user will select from a drop-down list
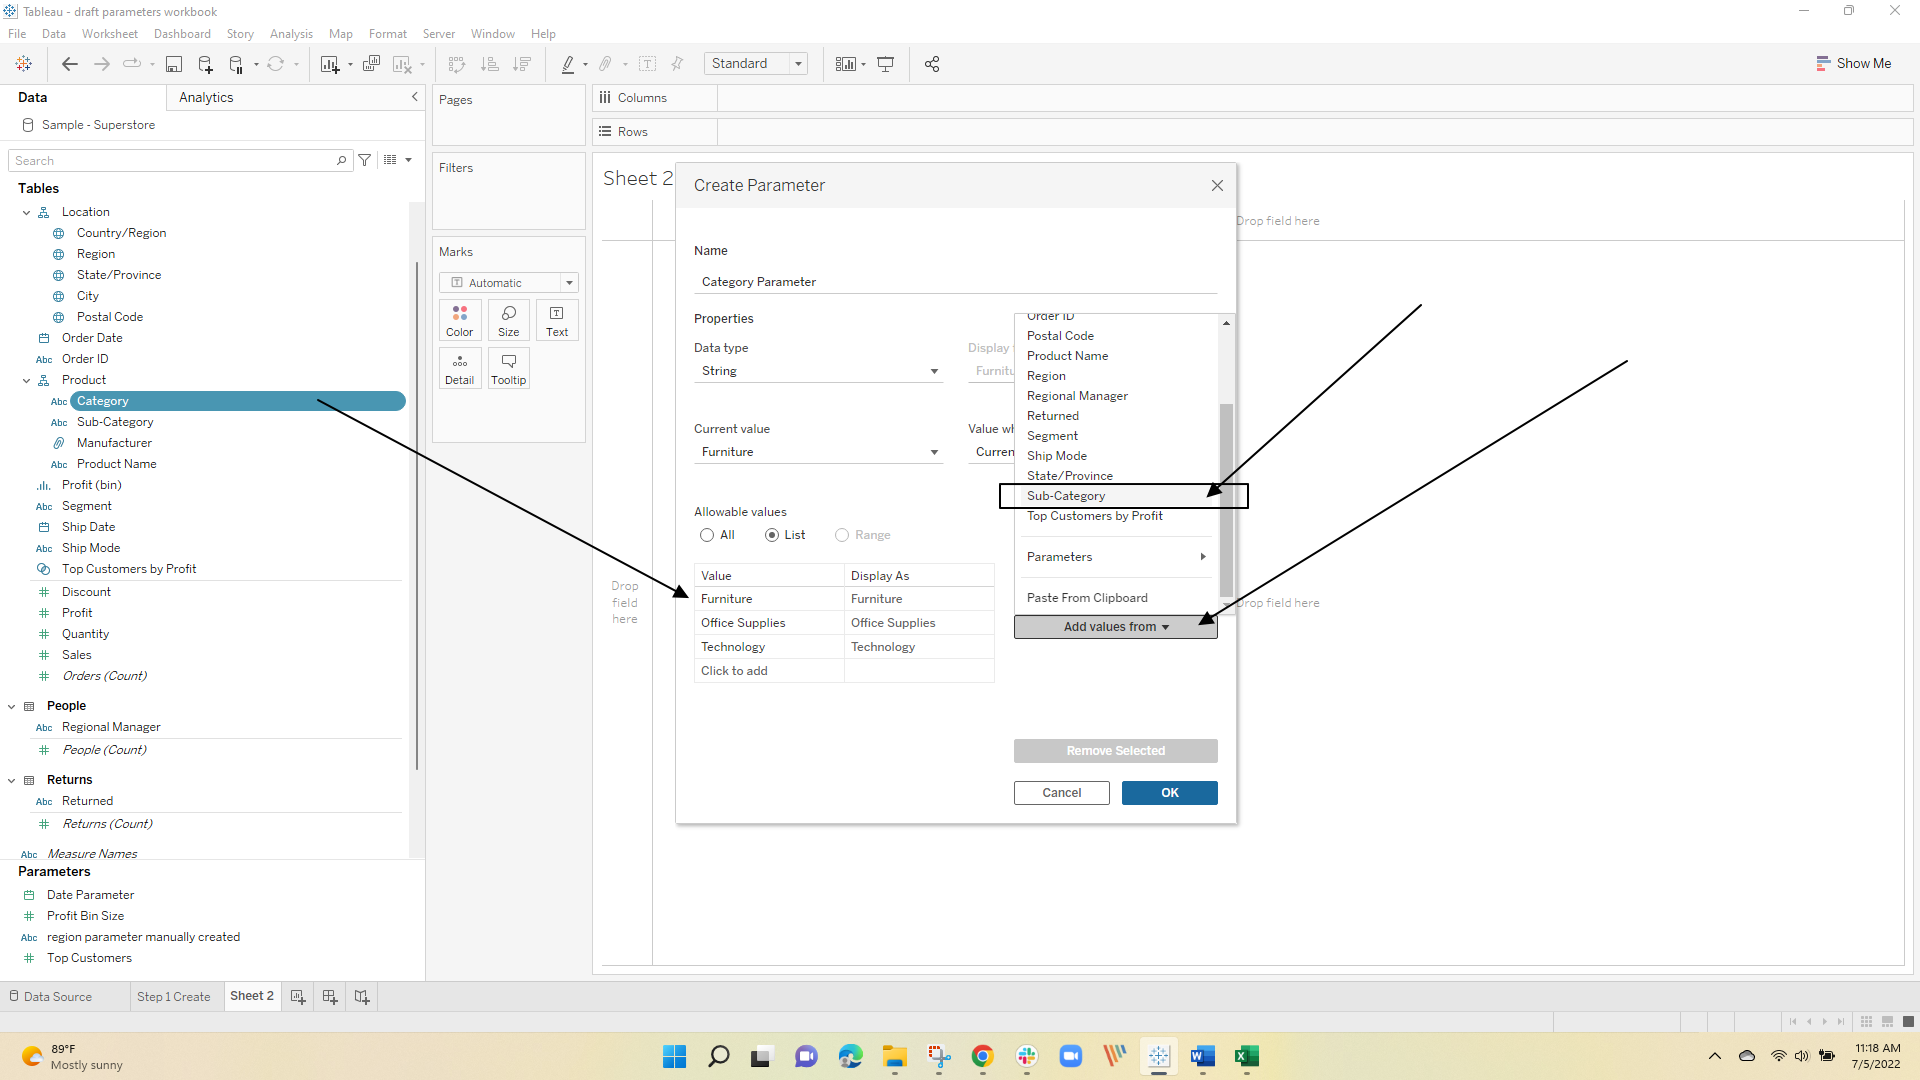
Finally, you can manually add or include multiple dimension values when you automatically load the parameter drop-down list:
After loading the Category values, select "Add Values " and select the dimension values to add when the window opens (here Subcategory)
2 Use the Parameter Value
Parameters are just a way to get a single value into Tableau but they don't do anything. Users often get confused and say they "Have a parameter that filters the data". Actually, they have a parameter and the value from that parameter is used in a filter that "filters" the data.
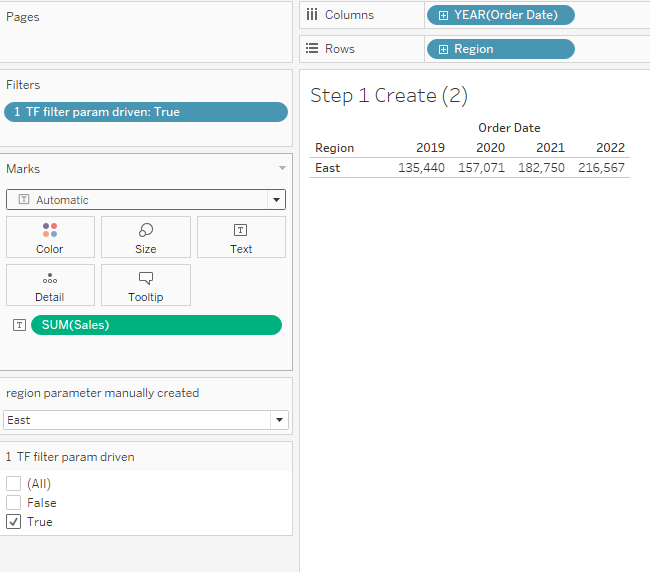
Using the Region Parameter created previously we can add a True/False filter
[Region]= [region parameter manually created]
And setting the filter to True when placing it on the filter shelf. The filter is now driven by the parameter value:
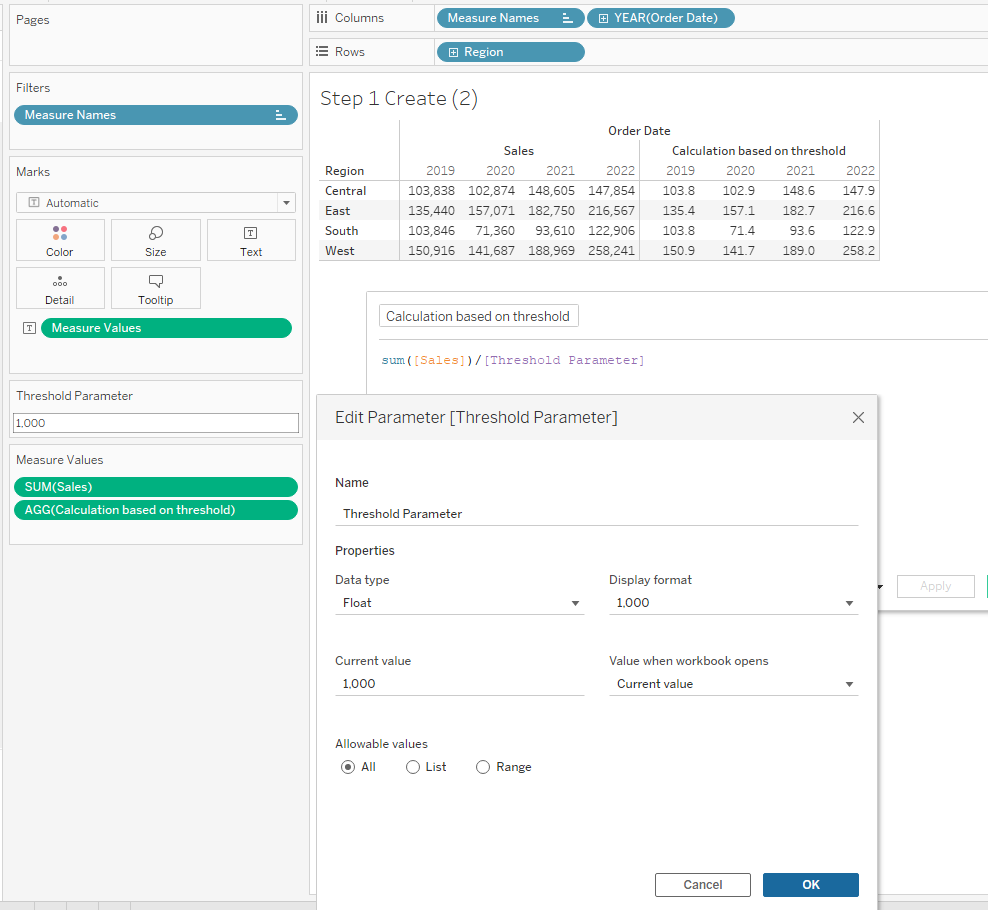
Parameter values can also be used in calculations:
Here I just created a Keyed-in floating-point parameter set to 1000 and this calculation
sum([Sales])/[Threshold Parameter]
to result in this
3 Ways to change the parameter value
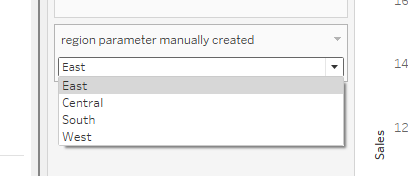
Parameter values are changed manually and the most common way is to show the parameter and select the value from a drop-down (radio buttons and also frequently used) or to key in a value:
Just open the parameter in the data frame and select "Show Parameter"
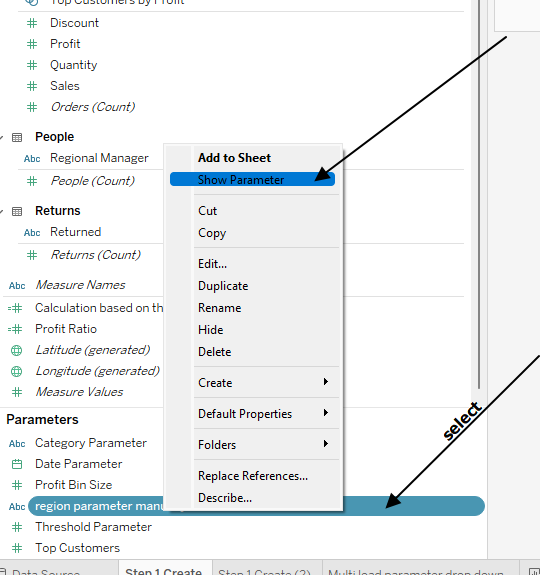
then select the value from the drop-down
You could also select a value from a value picker and use a parameter action which I will illustrate in a later example
4 Change the drop-down list and initial value when the workbook opens
With the 2020.1 release, Tableau introduced the functionality to update the parameter value list and set the initial value of the parameter when the workbook is opened. It is known as "Dynamic Parameter" and the feature works well but the name is confusing to many users – as noted previously, parameter values are changed manually not dynamically as the result of a calculation.
That said, the value list can be tied to the value of a dimension and the initial value can be based on a constant or other fixed value during the setup of the parameter.
Start by setting up a parameter – here a date – select when the workbook opens update – the from the date filed listed select the dimension you want to use in the parameter
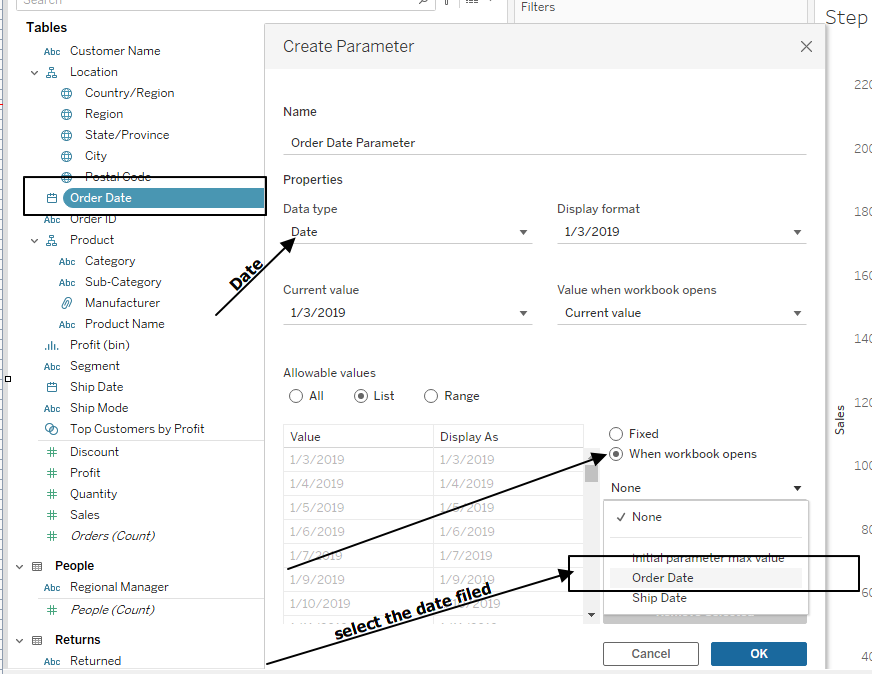
I also created a Table LOD to set the value of the parameter when the workbook opens to the max value in the data set
{max([Order Date])}
and on the setup window selected the LOD for the "when open" value
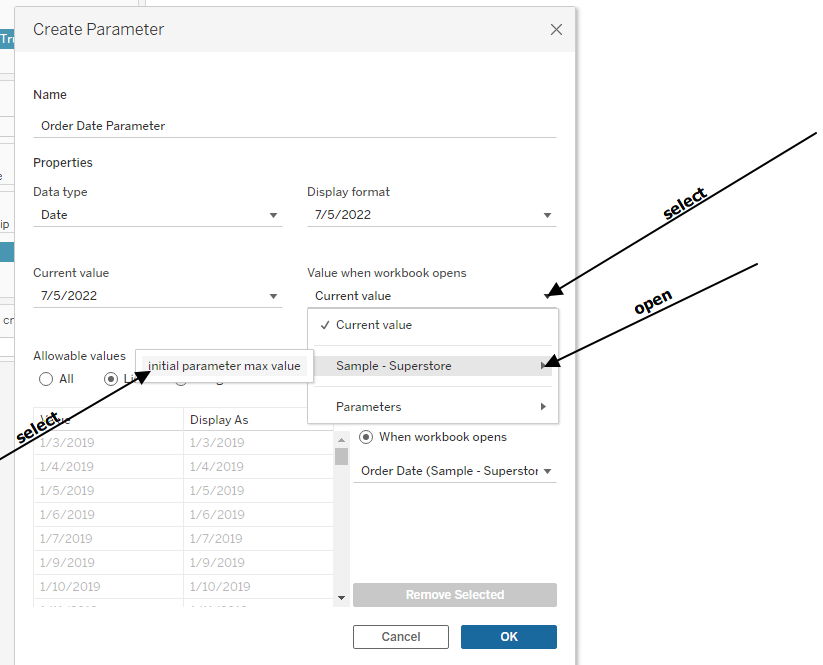
That's all there is to it – now when the workbook opens the list will update and then the initial value of the parameter will be set to that last date in the data set.
Let's look at some use case examples
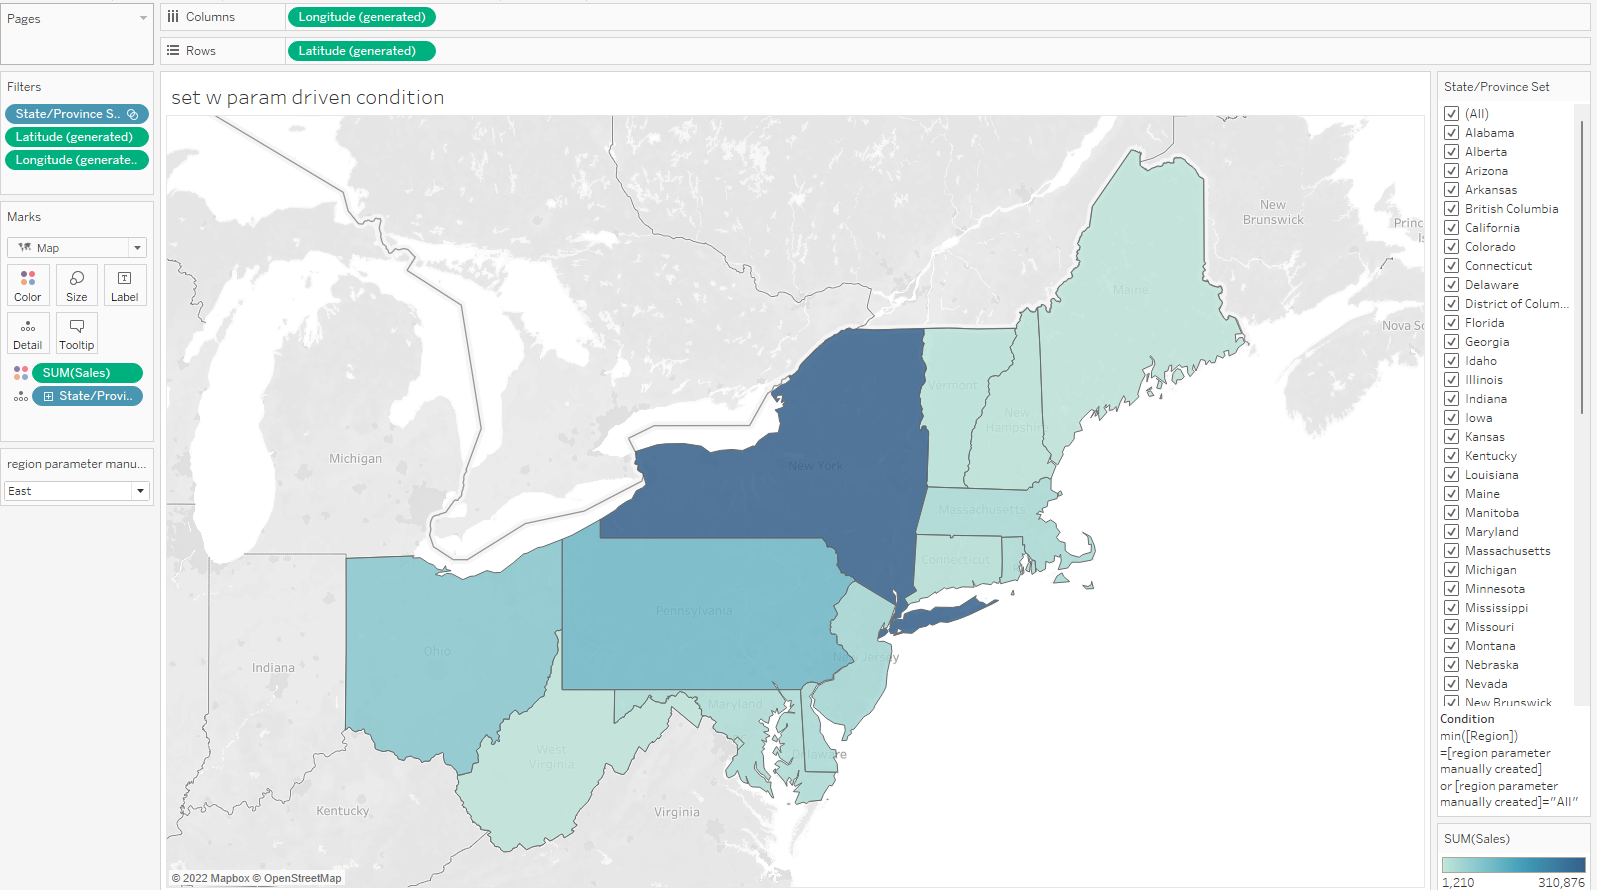
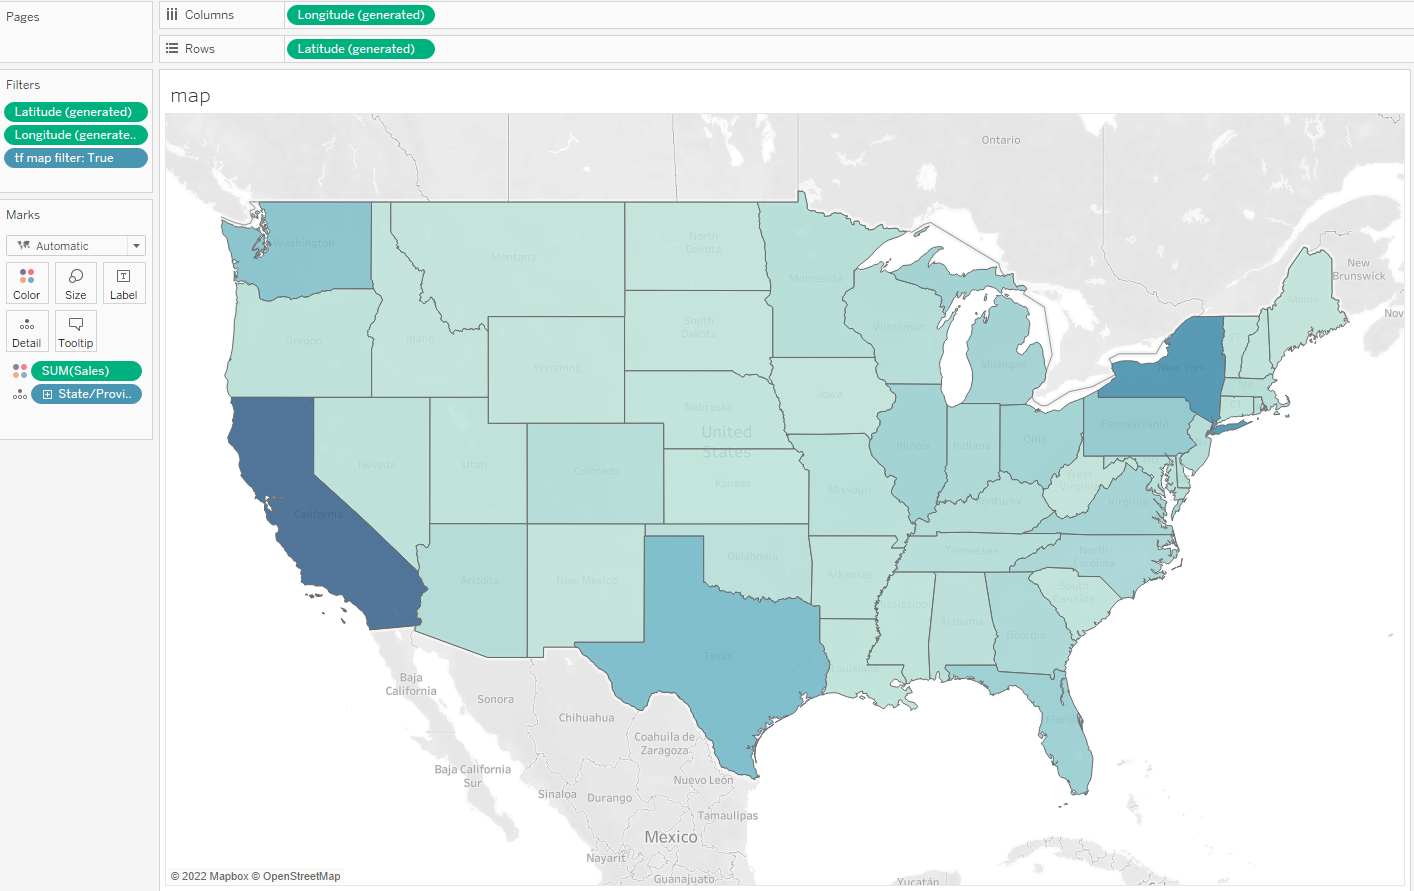
5 Manually driven map filter
Using parameters to allow users to select and filter data is the most example –
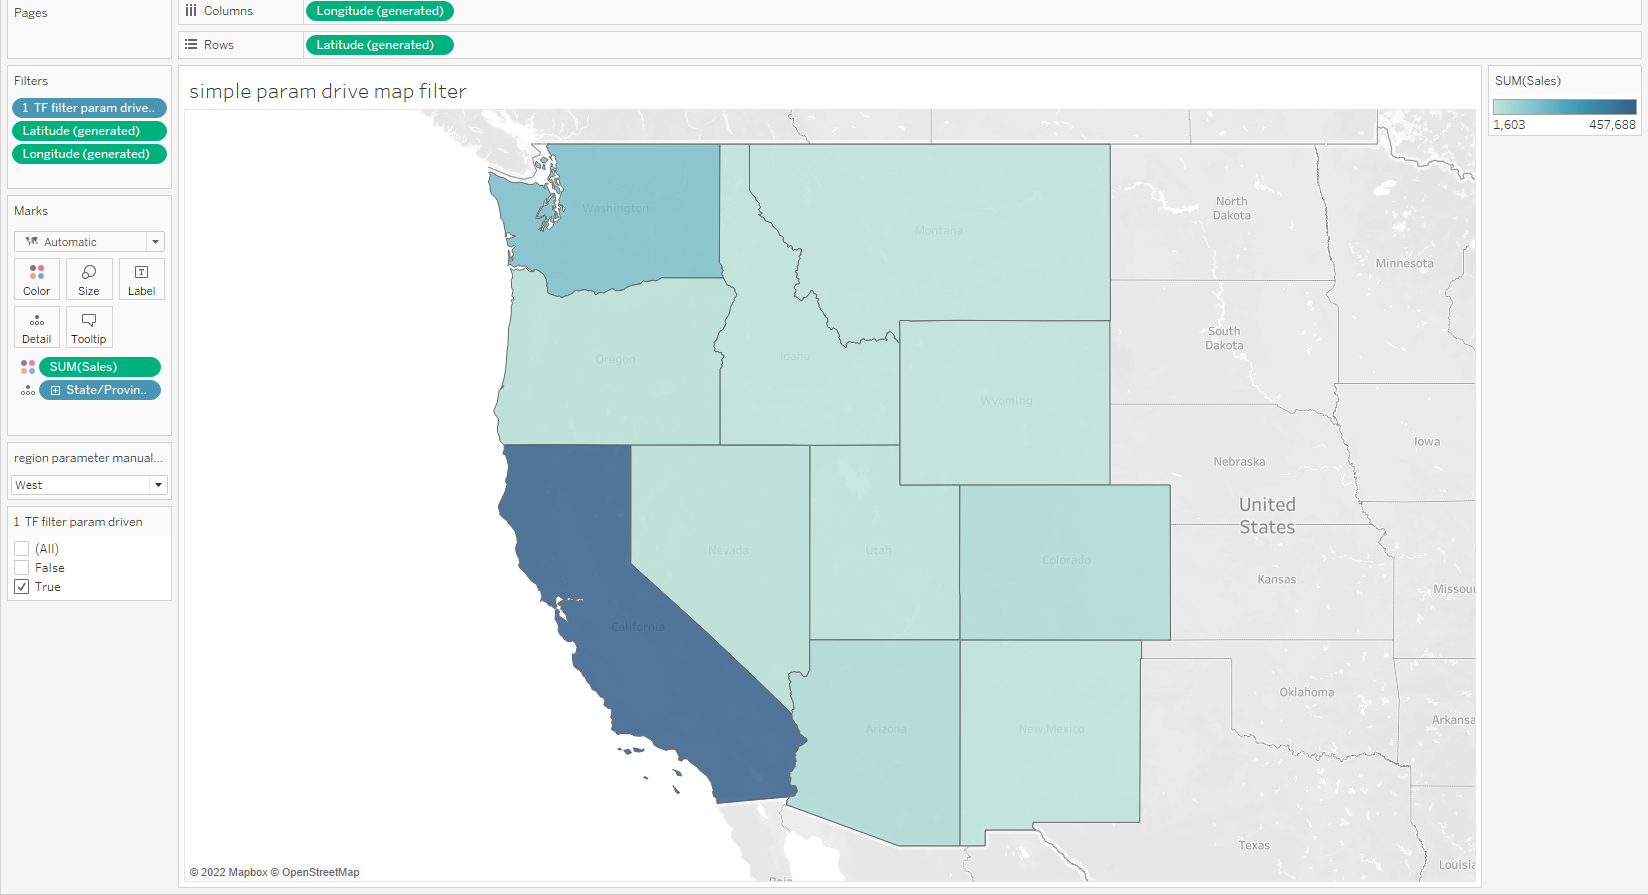
Based on the region parameter create above and adding the TF filter to drive the selection on a map would allow the user to view sales by region as
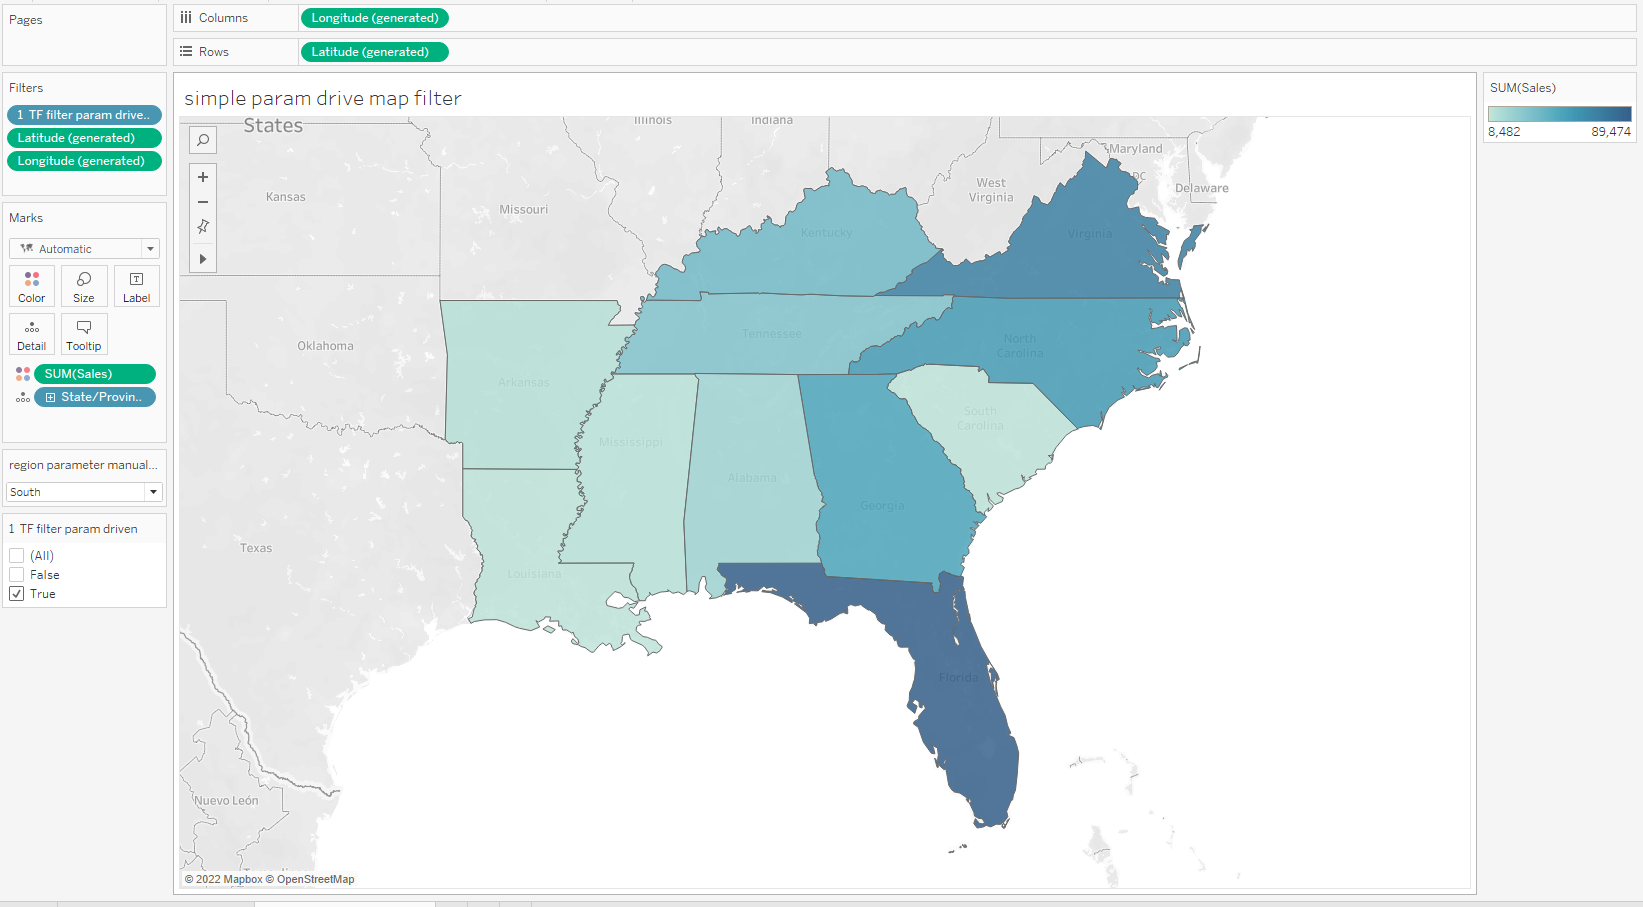
Changing the parameter will change the view –
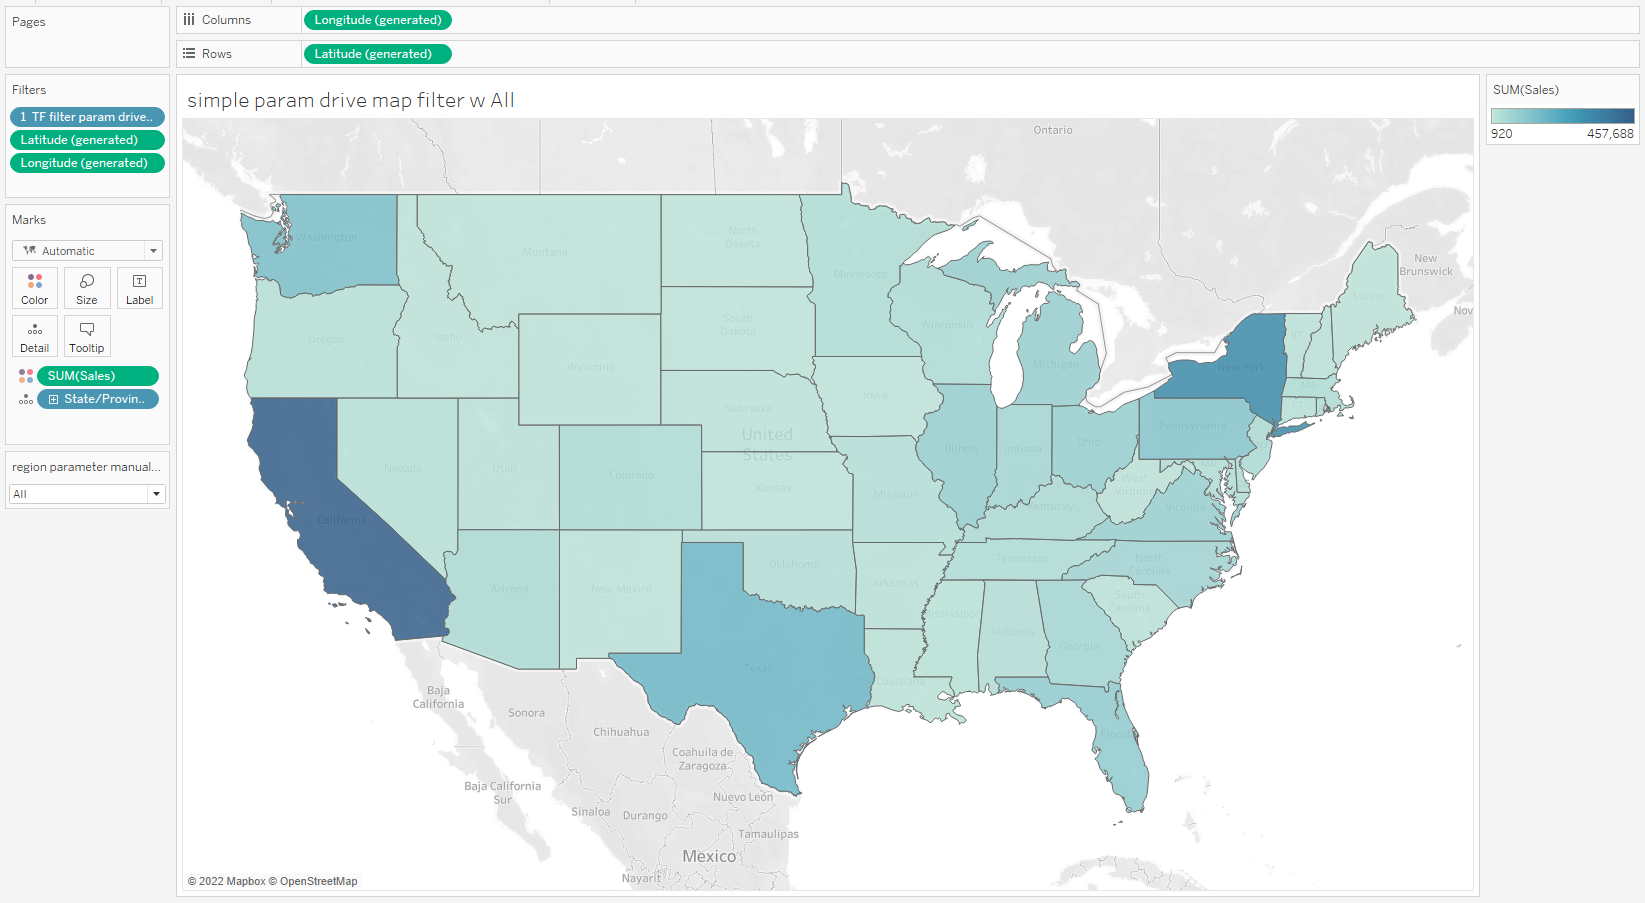
Users often want to include an All option – just add ALL to the parameter dropdown – and change the TF filter to:
[Region]= [region parameter manually created]
or [region parameter manually created] = "All"
and selecting All in the parameter will display this:
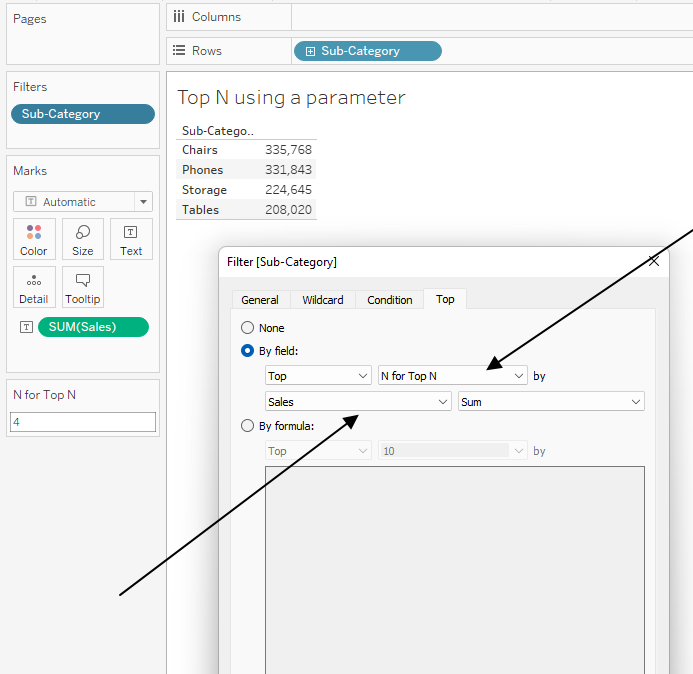
6 Use parameter on Condition or Top N tabs
Parameters are frequently used as part of a set or filter either as a condition or a Top N analysis – start with a Parameter for the N

Then create a filter using the Top N tab
7 Sets based on a Parameter Driven Condition
Begin by creating a set based on a parameter in the Condition tab – note the "formula area" is like a fixed LOD so dimensions must be aggregated and the formula must be Boolean returning a True / False value
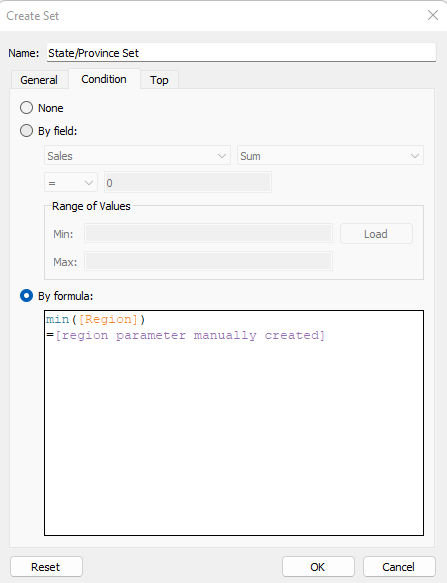
the set is now driven by the parameter value
There are many more examples of using parameters on the Condition or Top N tabs at See Post
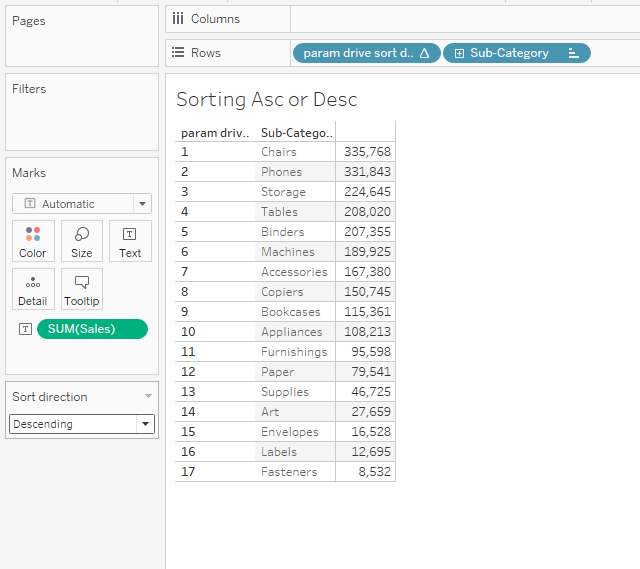
8 Sorting Asc or Desc Based on a Parameter
Create a string parameter to set the sort direction
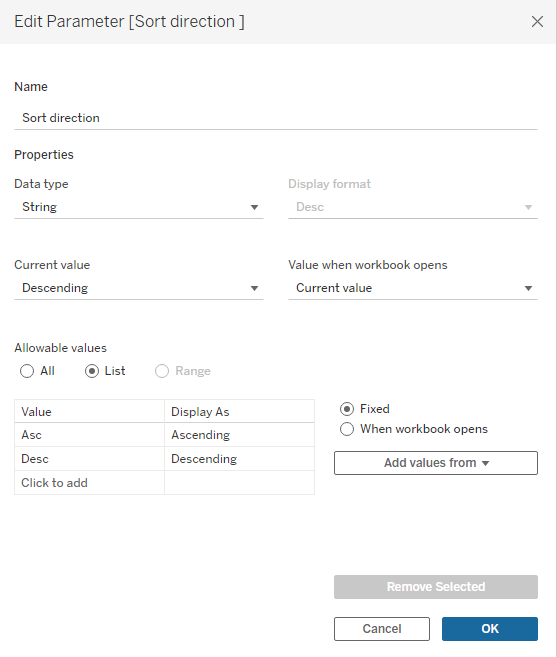
this calculation will rank the sales values
CASE [Sort direction ]
When "Asc" then RANK_UNIQUE(sum([Sales]),"asc")
else RANK_UNIQUE(sum([Sales]),"desc") end
Sorry, you can't simply use the parameter in the rank function
Then the sort direction is driven by the selection of the parameter value
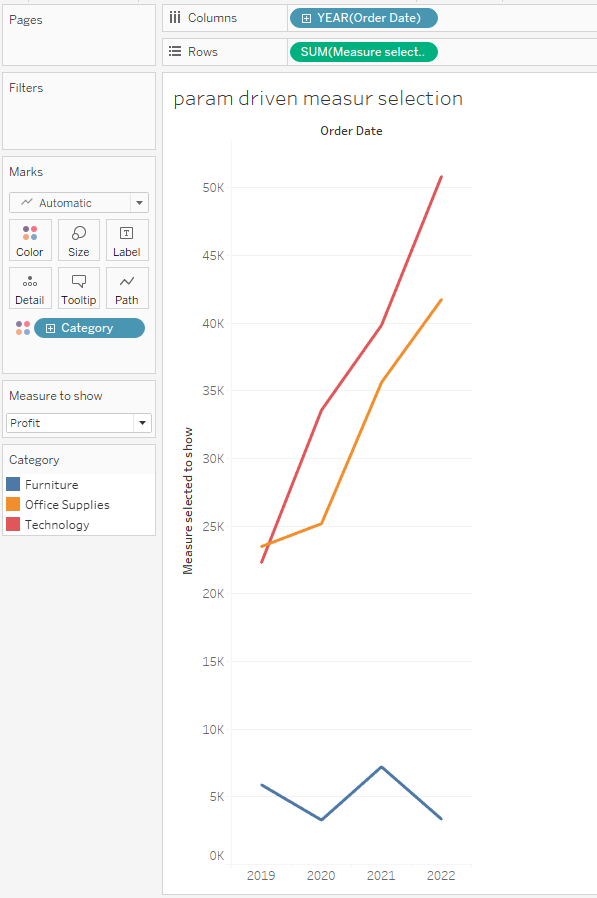
9 Selecting Measure to show
Similarly, users often want to be able to select the measure to show in a chart. That can be done with a parameter. Create the parameter first

then a case statement similar to
CASE [Measure to show]
when "Sales" then [Sales]
When "Profit" then [Profit]
when "Quantity" then [Quantity]
end
and then use the Case statement on the row shelf in the viz
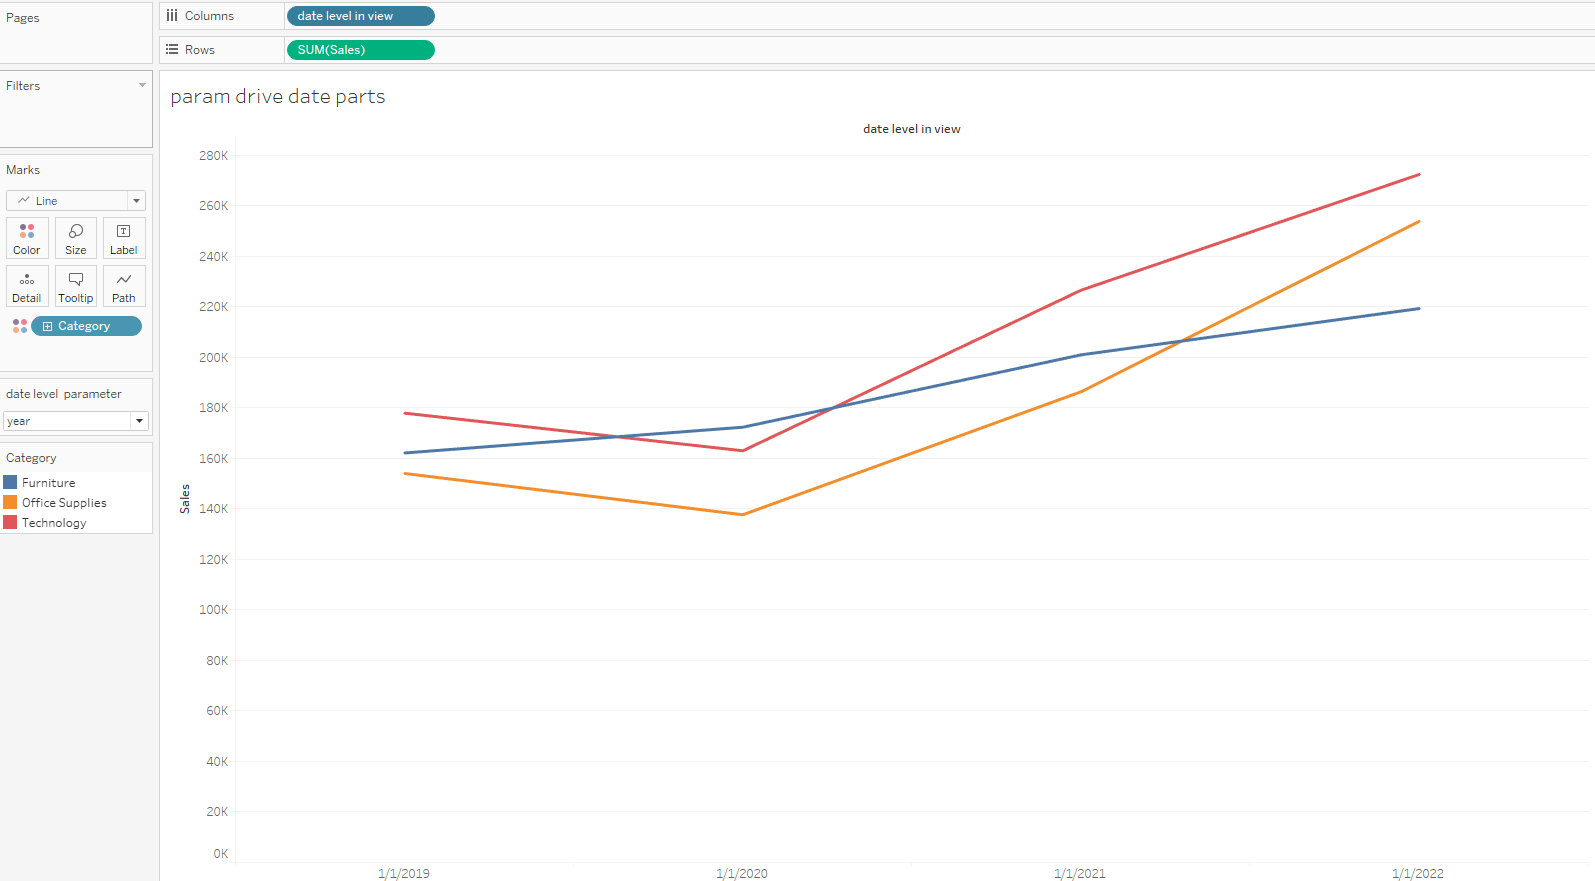
10 Select Date Level with a Parameter
A similar application is to use a parameter to select the date level to be shown. Here I'll only use 2 levels but you can expand to as many as you need.
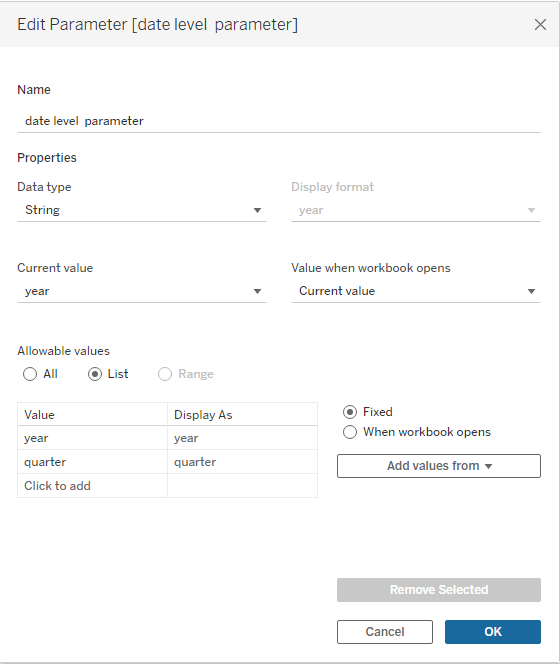
and then this calculation to use on the axis for date:
CASE [date level parameter]
When 'quarter' then date( DATETRUNC('quarter',[Order Date]))
when 'year' then date(DATETRUNC("year",[Order Date]))
end
place on the column shelf as an Exact Discrete date
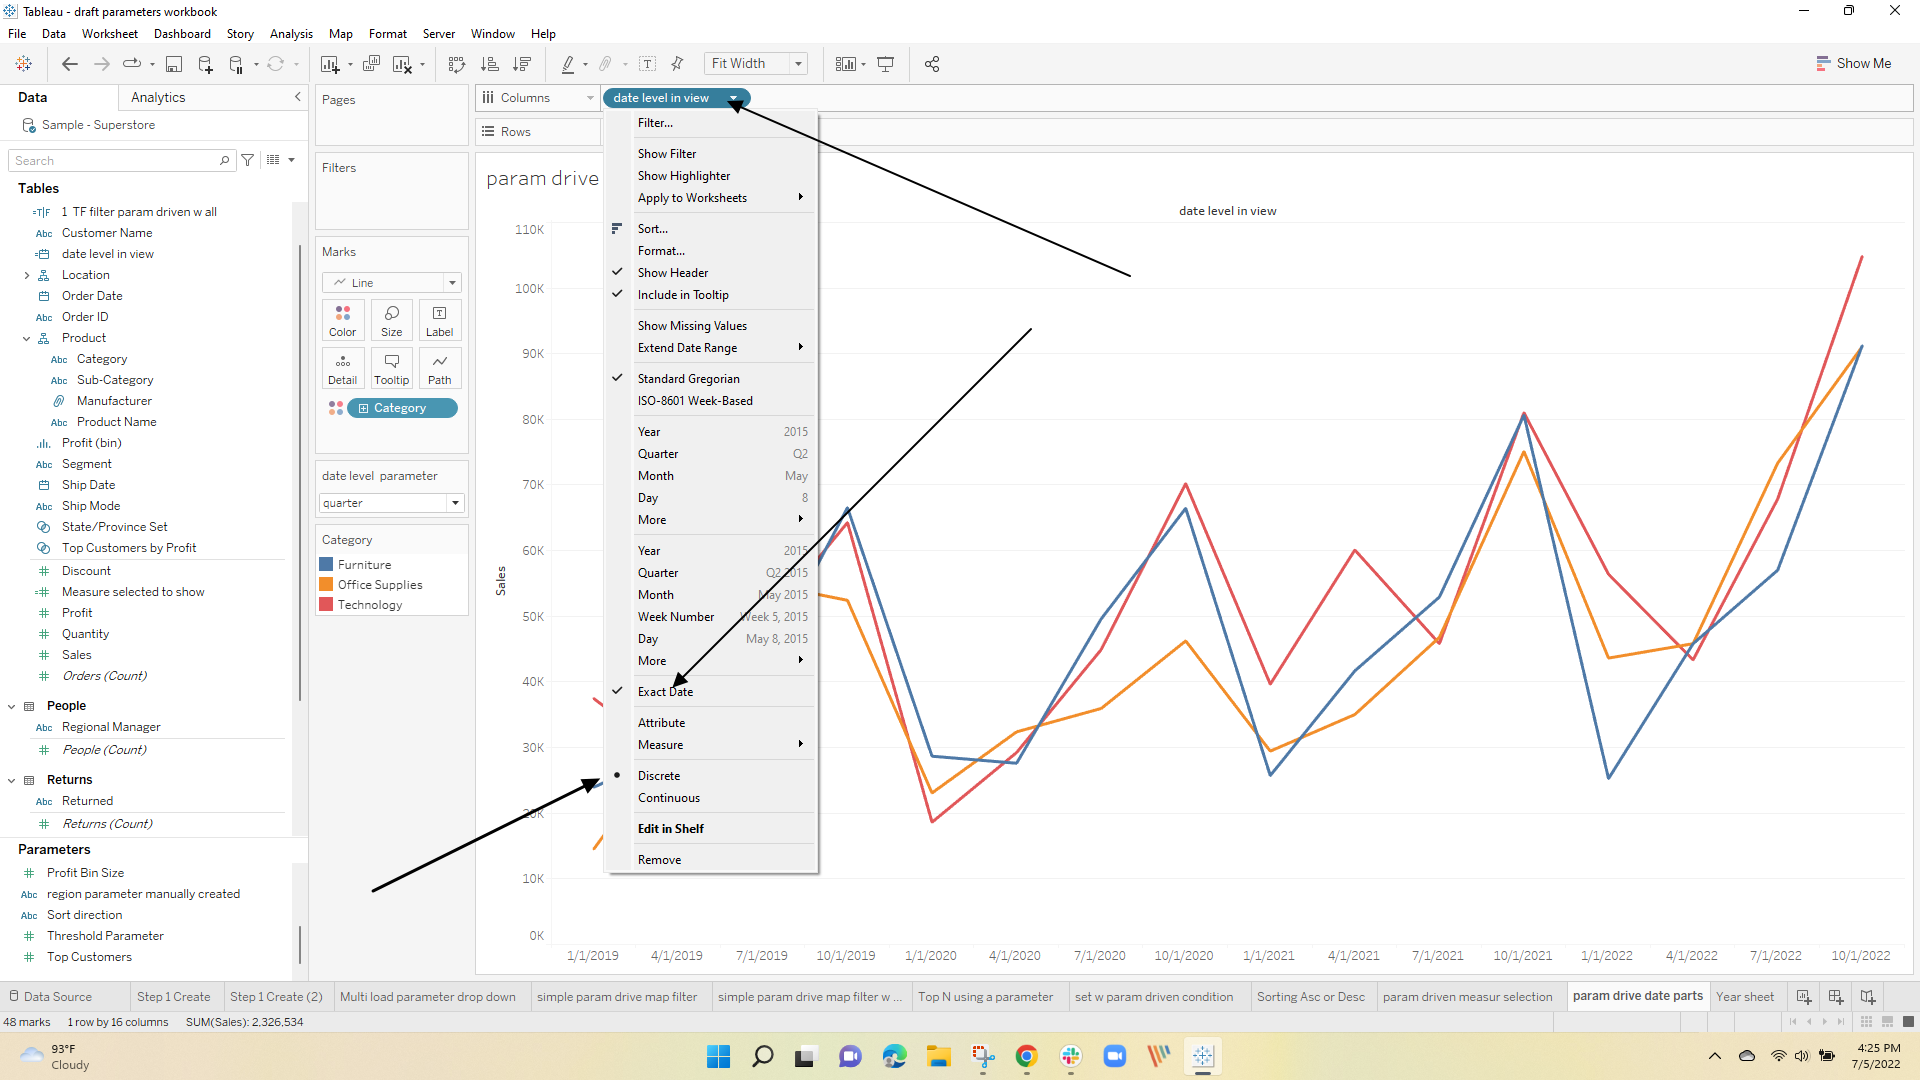
and now the parameter will drive the level of the data shown in the view
11 Sheet swapping using a Parameter
Sheet swapping is a way of exchanging worksheets on a dashboard – when done well the user will see the viz change but will not be aware that a new worksheet has replaced the old – but then again they don't need to
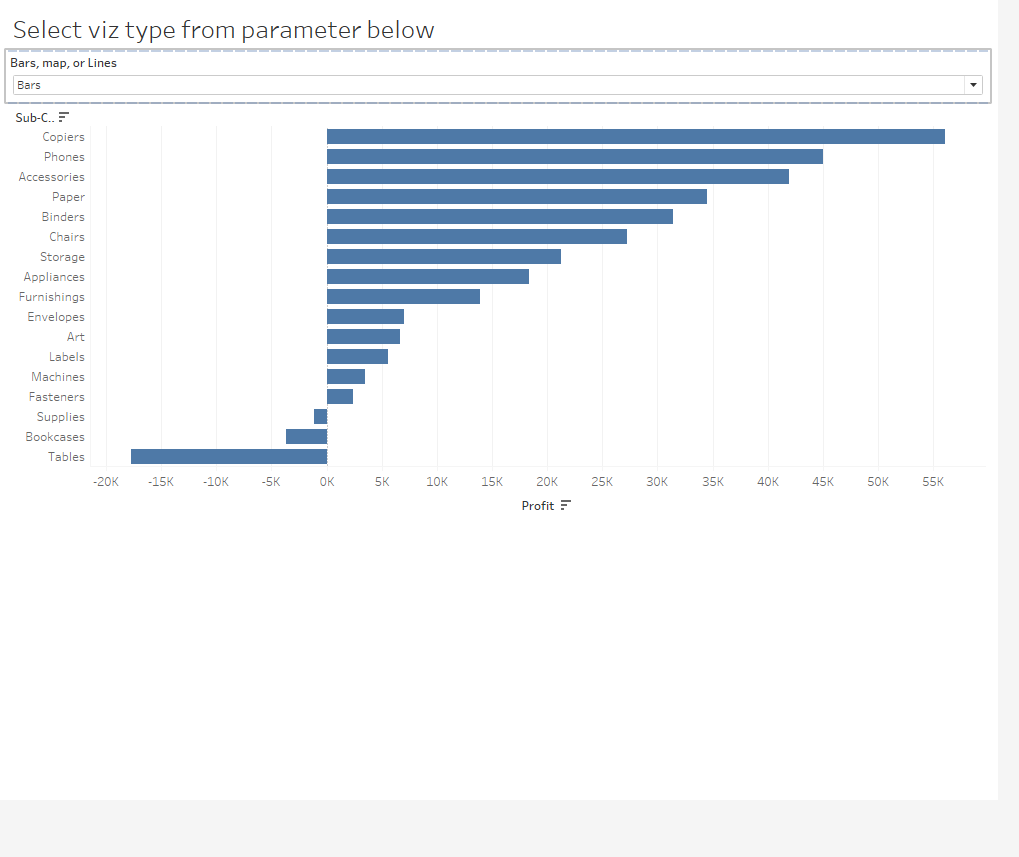
Start by creating individual worksheets you want to use in the dashboard – here – Bars

Map
and Line
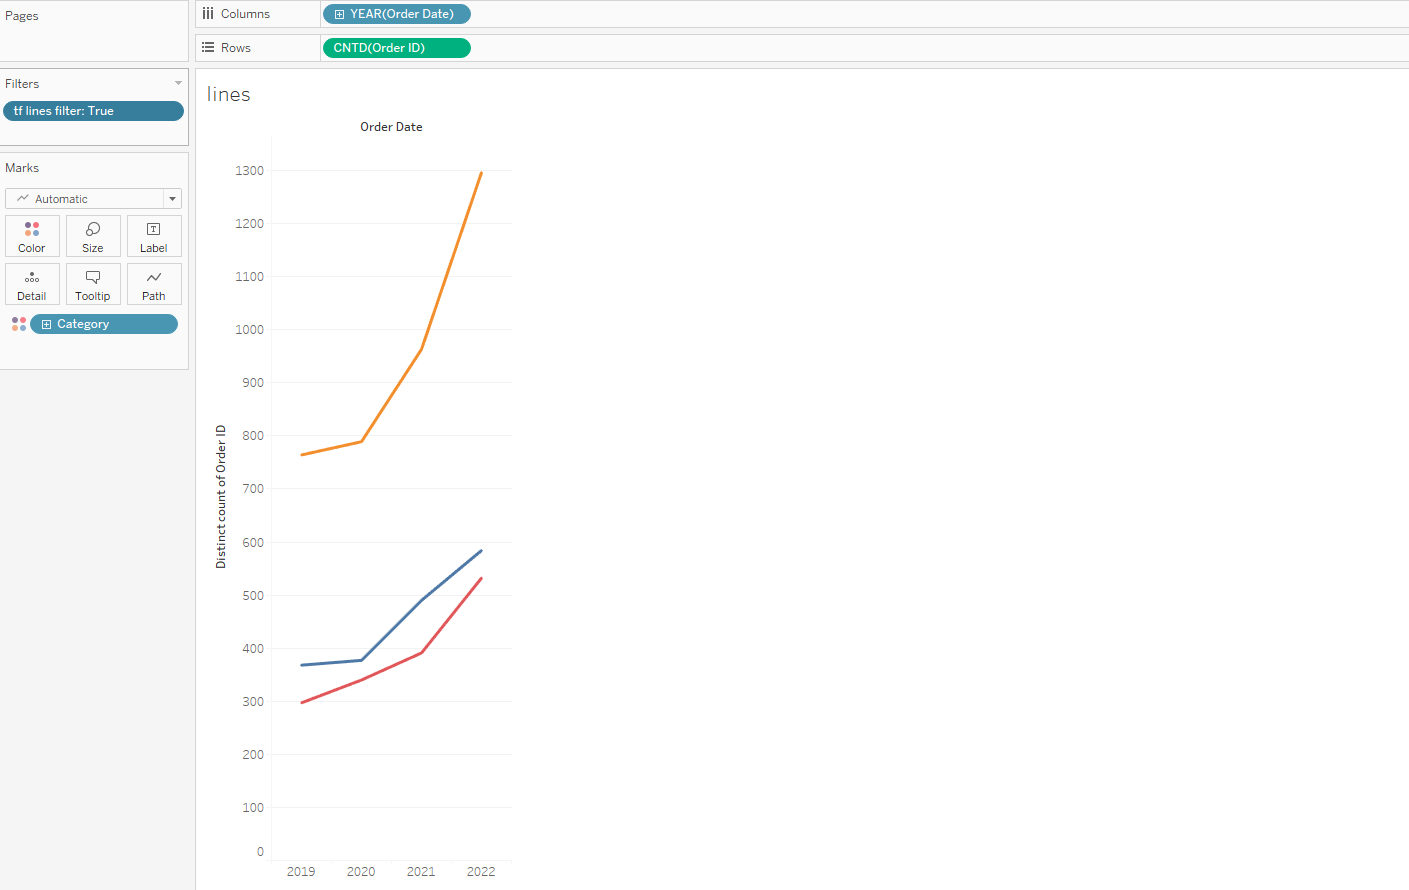
next, create the parameter the user will use to select the view
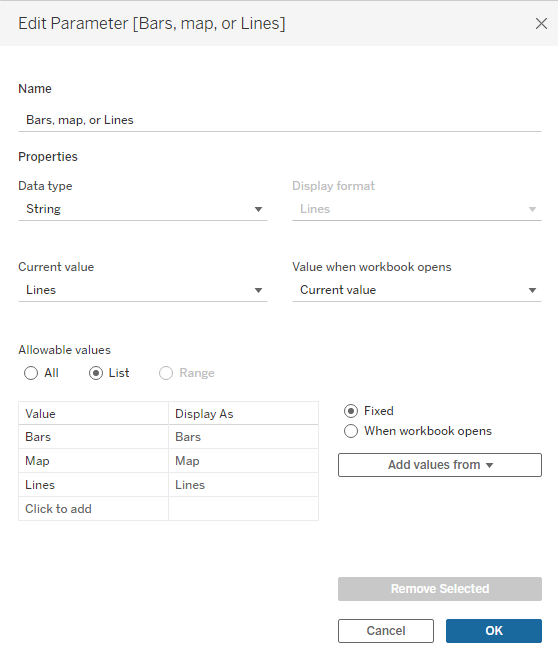
and add a T/F filter to each of the worksheets
e.g. on the Bars sheet, the filter is and is set to True on the worksheet (the other T/F filters would be similar
[Bars, map, or Lines]="Bars"
To complete the process open a dashboard and place an empty container on the canvas – place all 3 sheets in the same container and hide the worksheet title
add the parameter and now the view will change based on the parameter value selected:
12 Using Value Pickers and Parameter Actions
Parameter actions are a way to change the value of the parameter by selecting a mark on the viz and a value picker is just the marks the user can pick from.
For this one, I created a date parameter that will accept any date

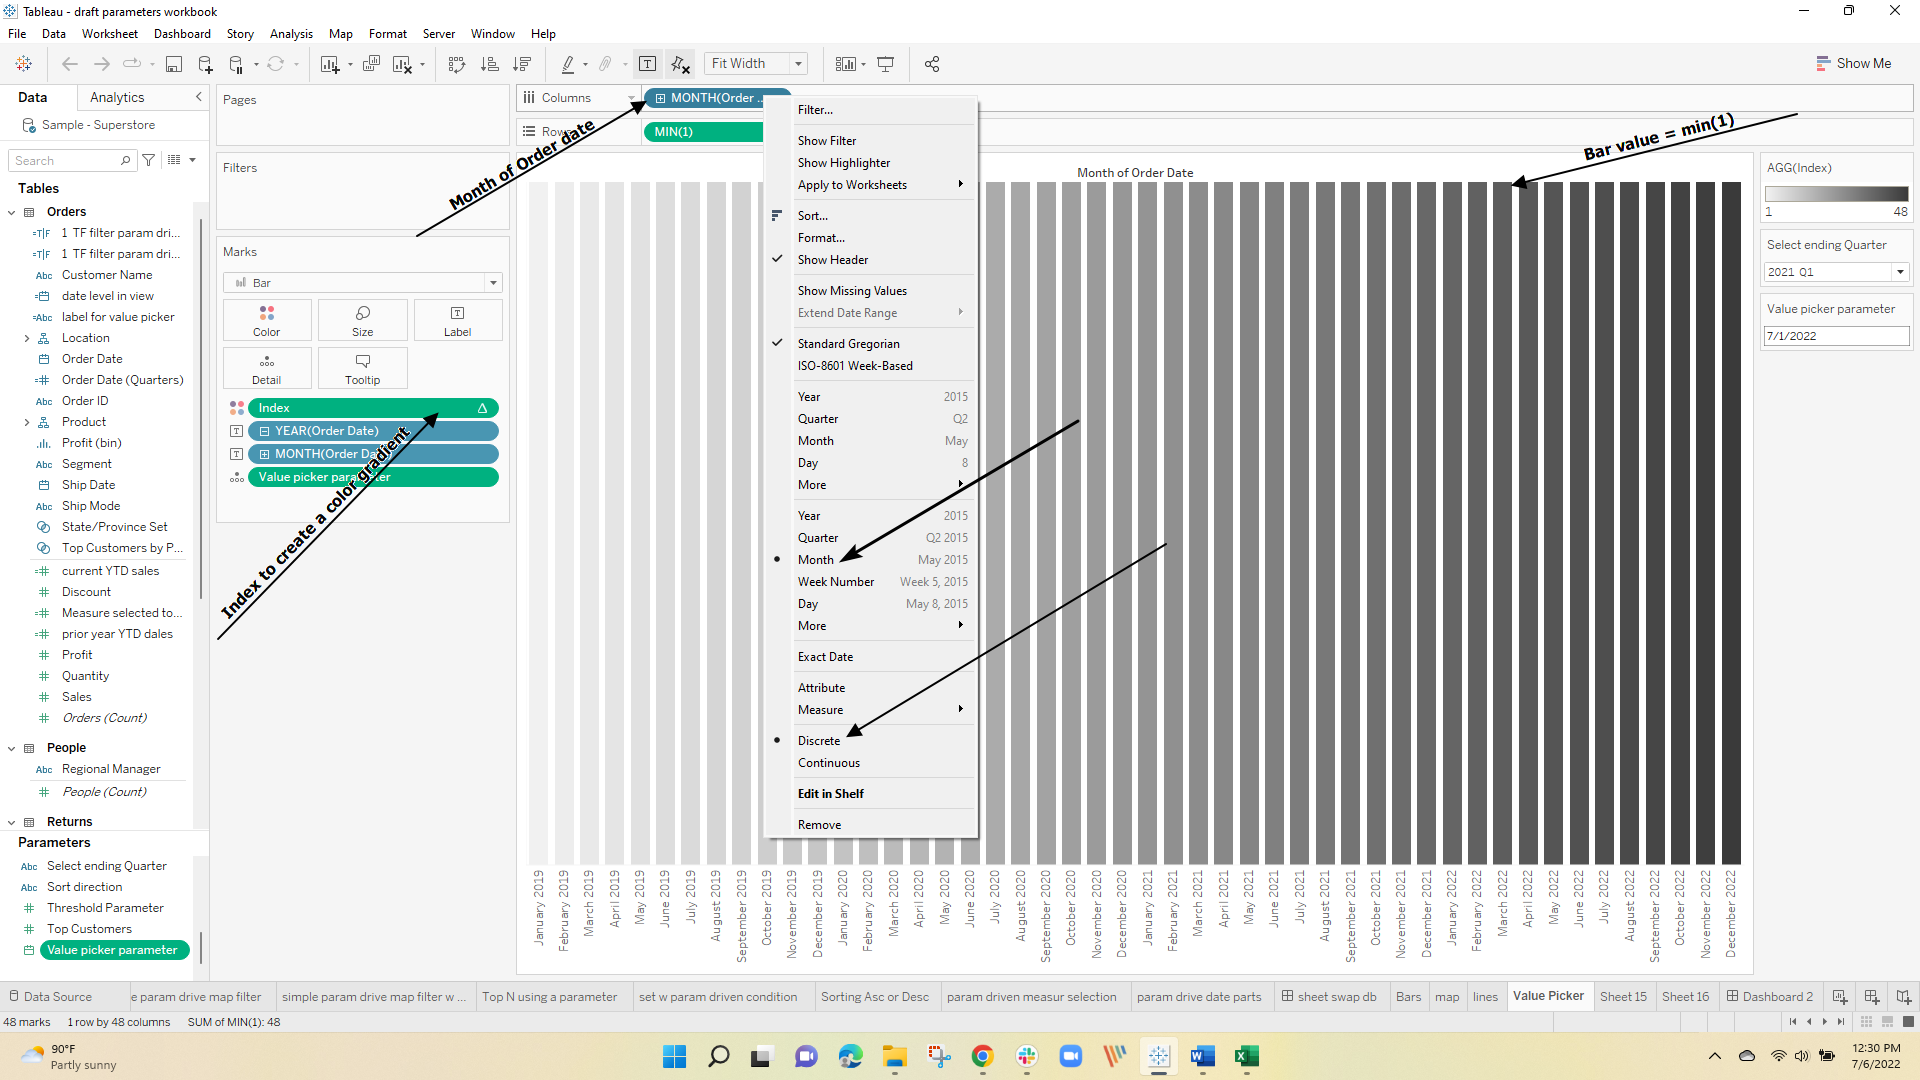
and then created a simple vertical bar chart that I used as the Value Picker – It may look a little complex but it is really just bars with a value of 1 – the columns are the discrete version or continuous Months of the order date. I used an Index on color to create a gradient
Then create simple text table to do a YTD to Prior YTD analysis based on the parameter value
This is the current year LOD
{ FIXED [Order Date]: sum(
if datetrunc('year',[Order Date]) = datetrunc('year',[Value picker parameter ]) and
datetrunc("month",[Order Date])<= DATETRUNC('month',[Value picker parameter ]) then [Sales] end)}
and this is Prior year
{ FIXED [Order Date]:sum(
if datetrunc('year',[Order Date]) = datetrunc('year',dateadd('year',-1,[Value picker parameter ])) and
datetrunc("month",[Order Date])<= DATETRUNC('month',dateadd('year',-1,[Value picker parameter ])) then [Sales] end )}
and the YoY % percent change
sum({ FIXED [Order Date]:
(sum(zn([current YTD sales]))-sum(zn([prior year YTD dales ])))})/
sum({ FIXED [Order Date]: sum(zn([prior year YTD dales ])) })
Now all that is left is to get the parameter value to change when the user hovers over the value picker. That is done with a parameter action:
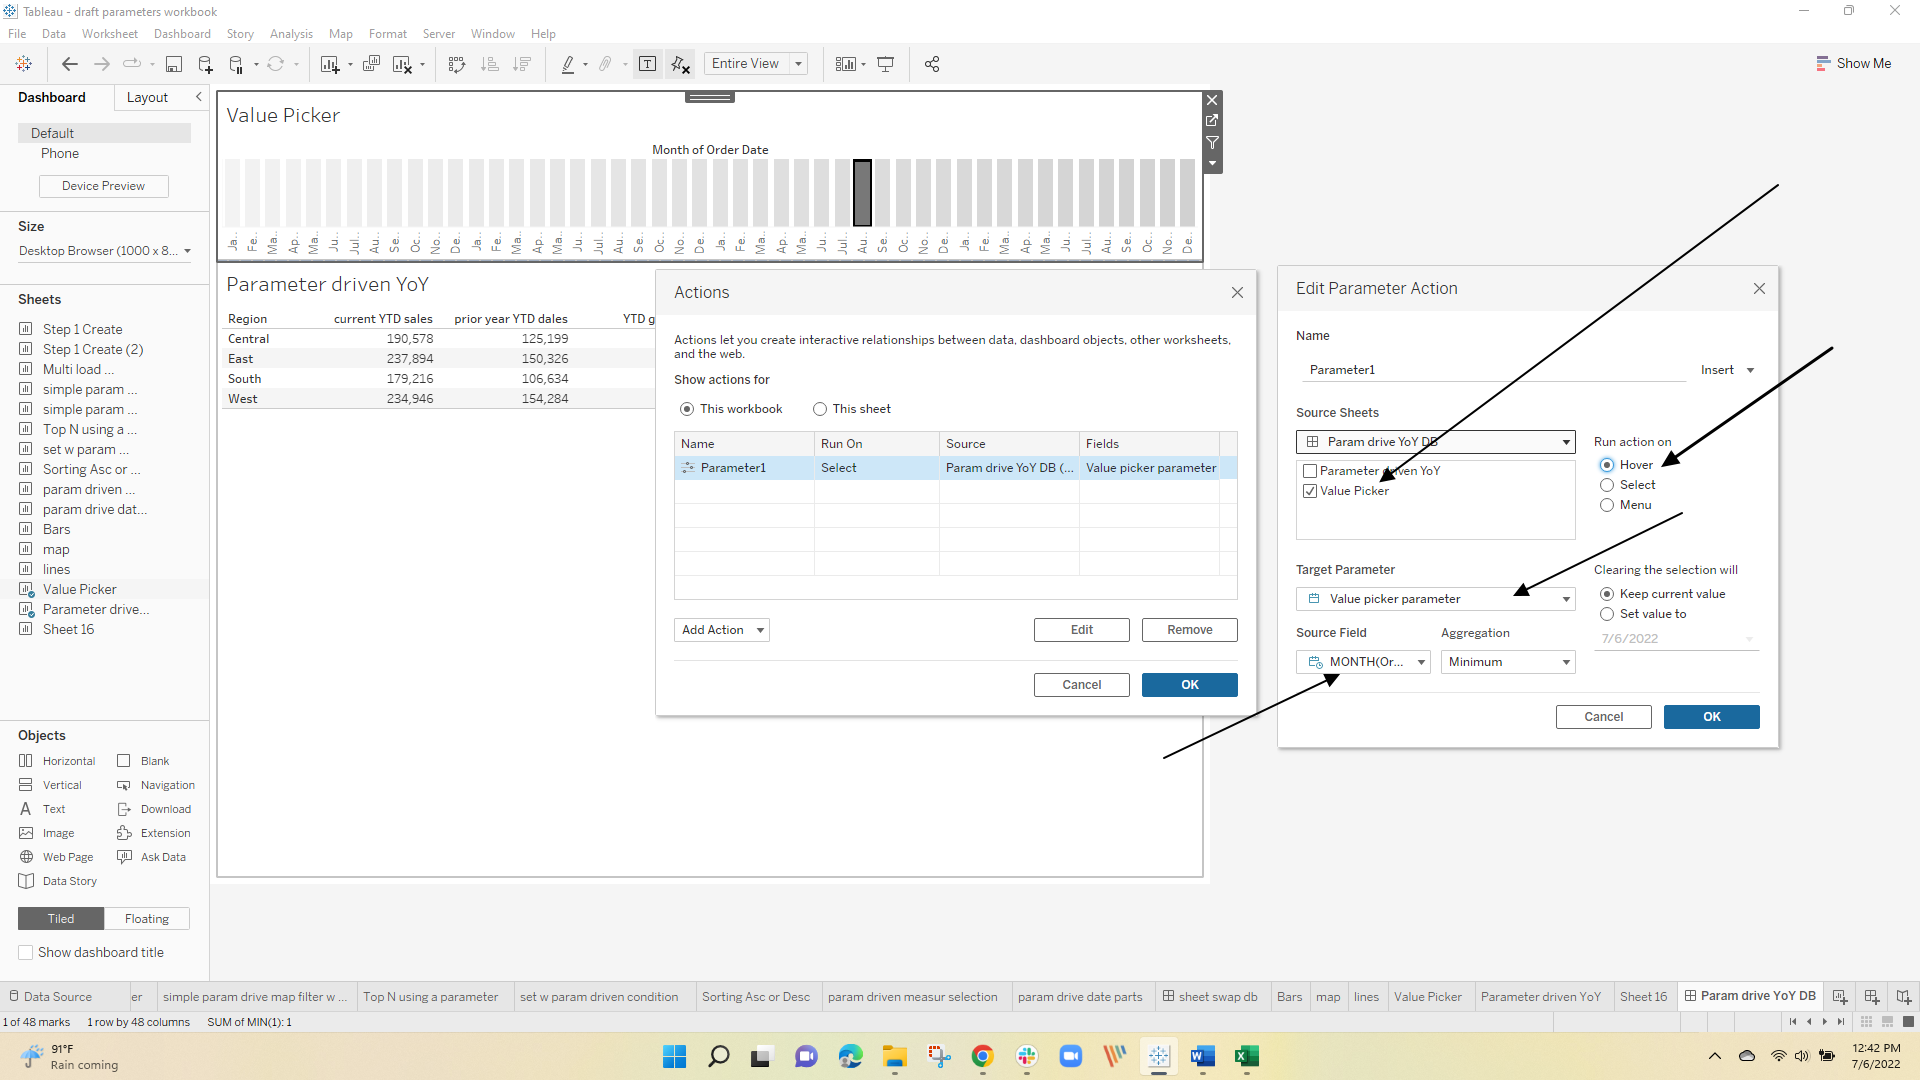
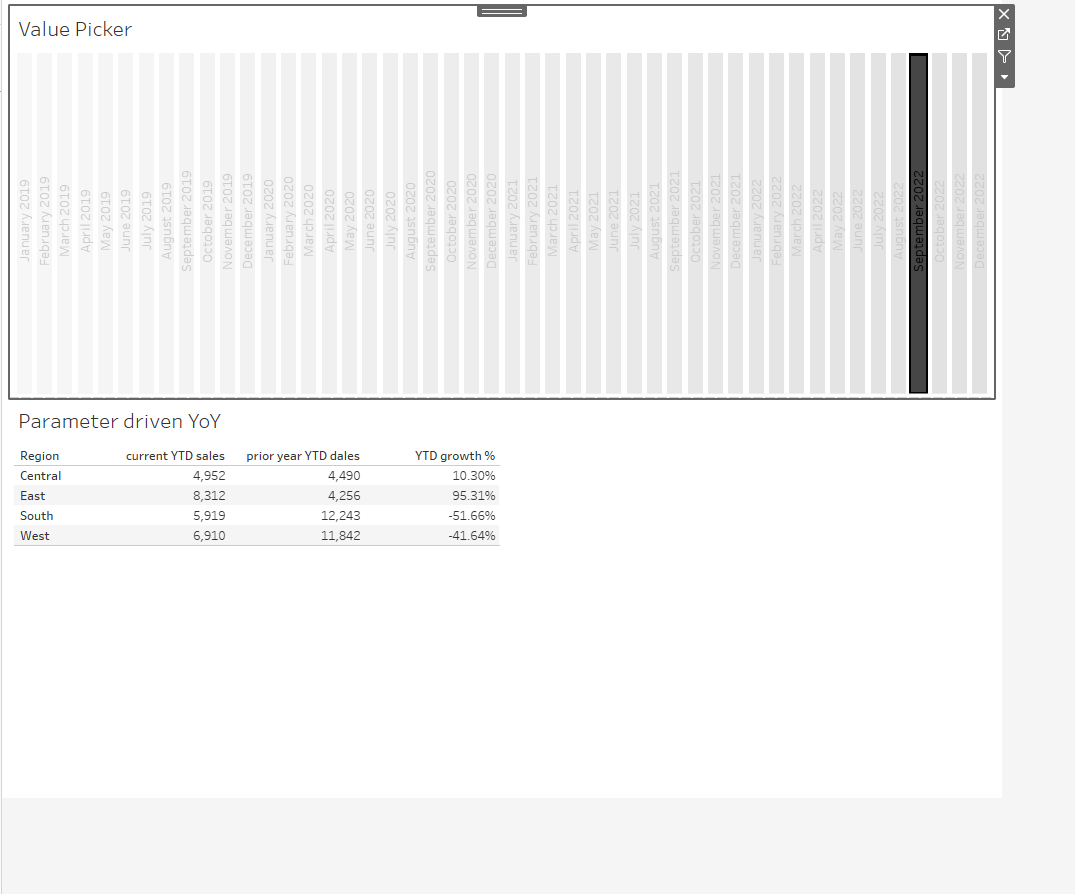
and the resulting dashboard will change the YoY analysis based on the parameter value
There is one final topic that comes up on occasion – cascading parameters or parameters that are dependent on the selection from another parameter. That is not a native function in Tableau but there is an extension that can be used – It is a bit complicated and I have written about it previously -see This post the 7th example
Hope this helps you better understand parameters and their use
The workbook with the examples shown here can be downloaded from my Tableau Public site at Link to Workbook
Enjoy
Jim

2 Responses
very clean and precise execution with parameters
Elegant and clear explanation, as usual!