
Recently, we've seen many questions on the Forums on Grand Totals and Sub-Totals –
- how they are calculated,
- when to use them or another approach to get totals,
- how to sub-total some – but not all of the measures –
- what to do when they return an unexpected result.
See the video at Link to GT Video
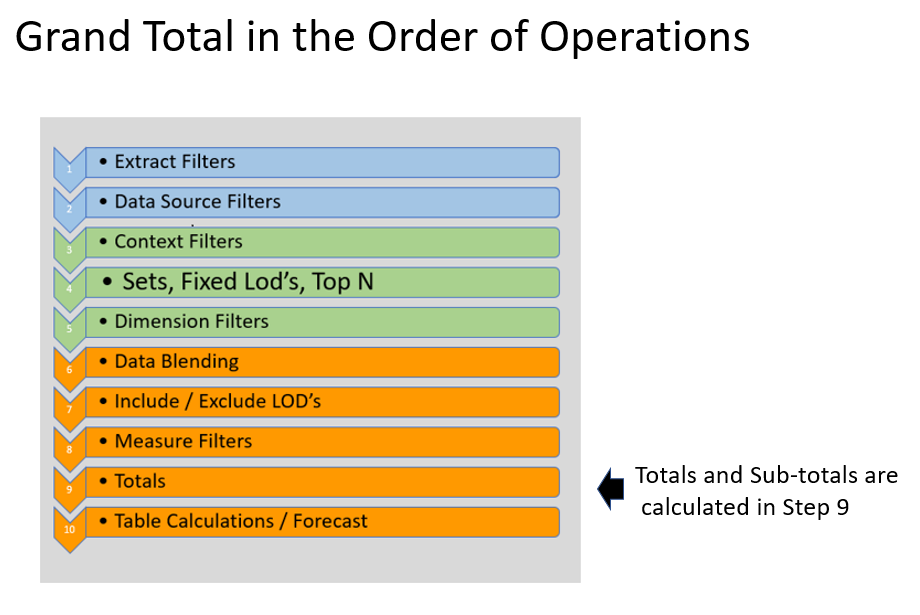
A good place to start is with an understanding of how Grand Totals and subtotals are calculated. Unlike spreadsheet calculators, totals in Tableau are not the sum of the values in the column – Grand Totals are calculated from the base data, the dimensions in the view, and any filters applied. In the order of operations, they are calculated in Step 9 after the worksheet data table structure is created in Steps 3-5, and measure values are loaded, calculations executed, and measure filters applied in Steps 6-8
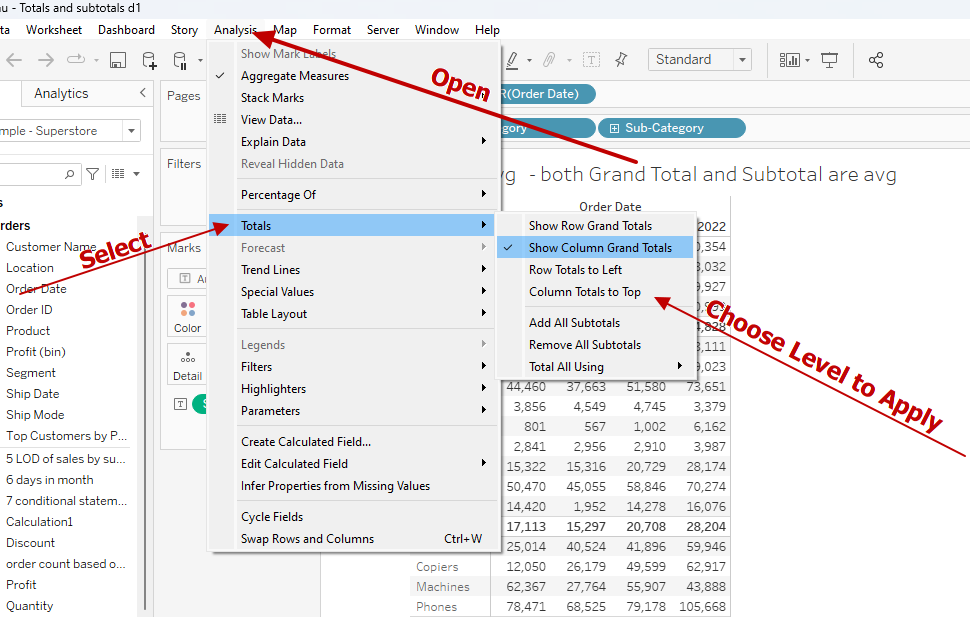
The Grand Total and Sub-Total functions are located on the Analytics tab and can be accessed in 2 different ways
First directly from the Analysis dropdown on the top ribbon
Or you can Drag-and-Drop from the Analytics Frame –
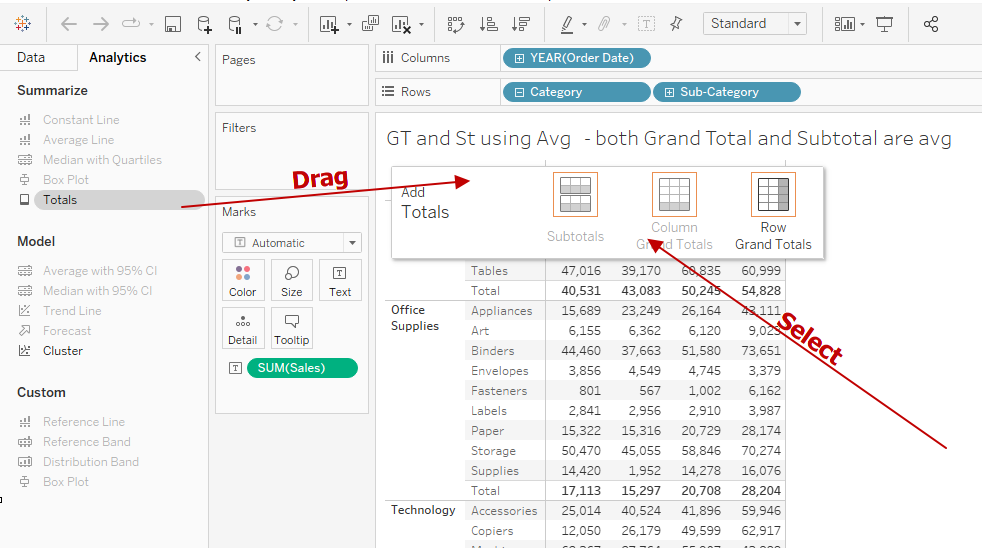
Let's see how to use them:
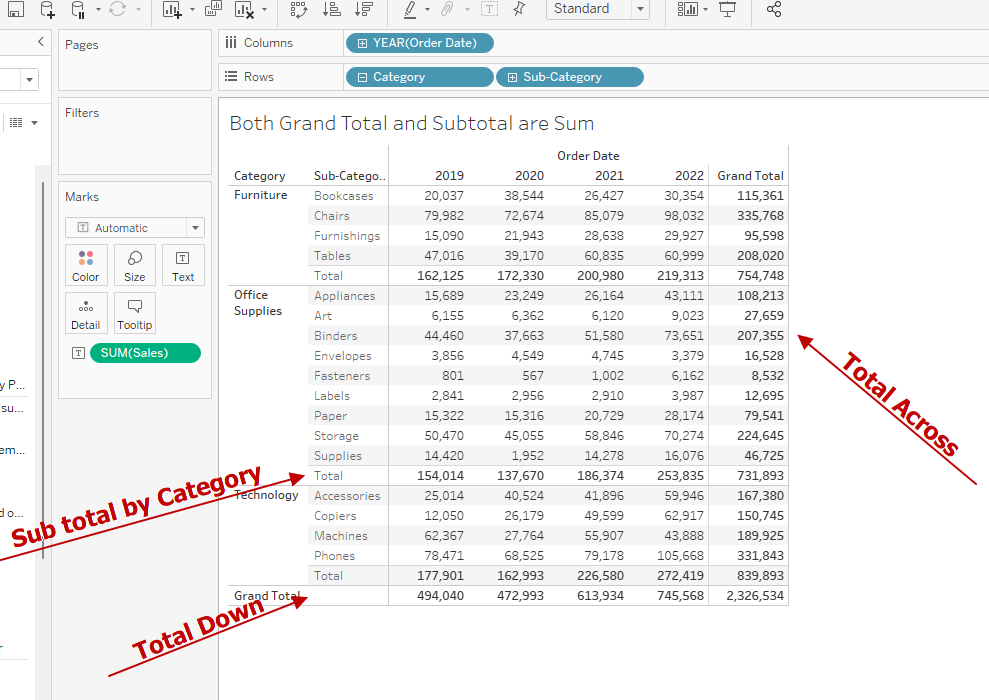
1 Basic Totals and Sub-Totals
Grand Totals and Sub-totals are aggregated with sum() by default as you add them to the view
The default aggregation can be changed by opening the Total Using (Note changes are applied to all Totals and Sub Totals in the view)
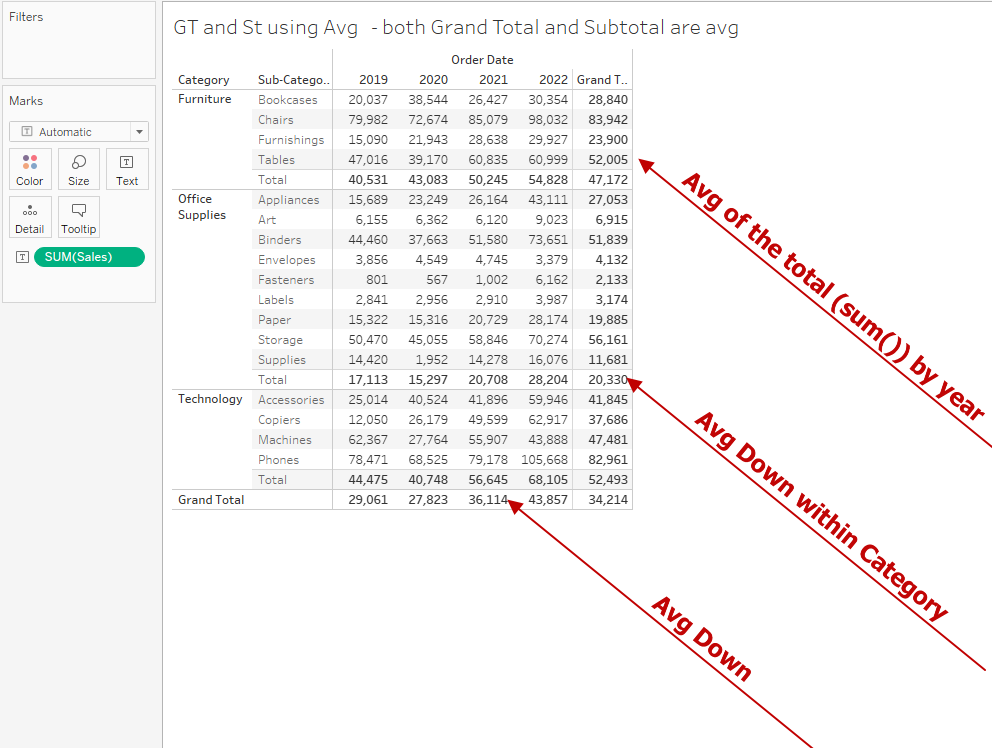
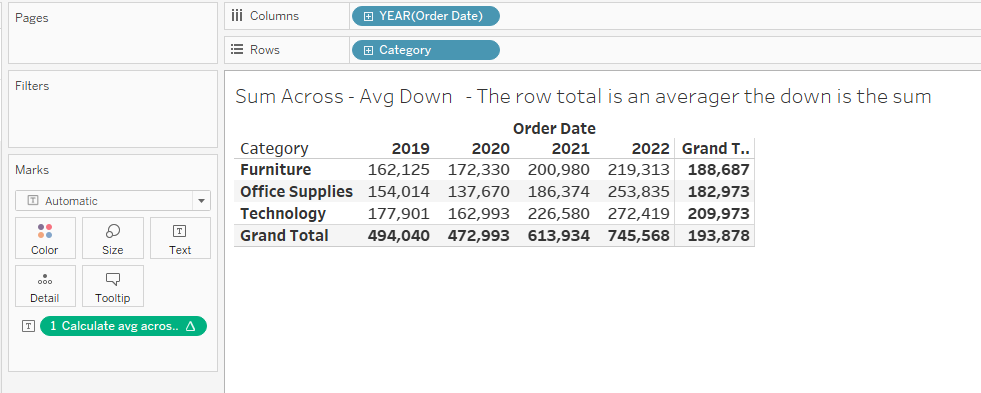
2 Custom Totals and Sub-totals
You may need to have the total summed down the chart but want the average across – That can be done by adding a custom total:
if SIZE()=1 then avg ({ FIXED [Category],year([Order Date]):sum([Sales])} )
Else sum({ FIXED [Order Date],[Category]:sum([Sales])})
end
the calculation uses the Size() function and takes advantage of the fact that Size is 1 in the Grand Total or Sub-Total cells – (this is one way to customize totals – we will see others in later use cases)
The First clause will average across the table and the second will sum down the columns
3 Calculating averages
Calculated averages or rates causes users a lot of problems and I always recommend calculating the numerator and denominator separately and then doing the division. We see many questions on the Forum that the totals for averages are not correct, or nulls were not taken into account properly. Sorry, but Tableau is only doing what you asked. Using the AVG() aggregation takes the total of the measure and divides it by the count of the records. See below
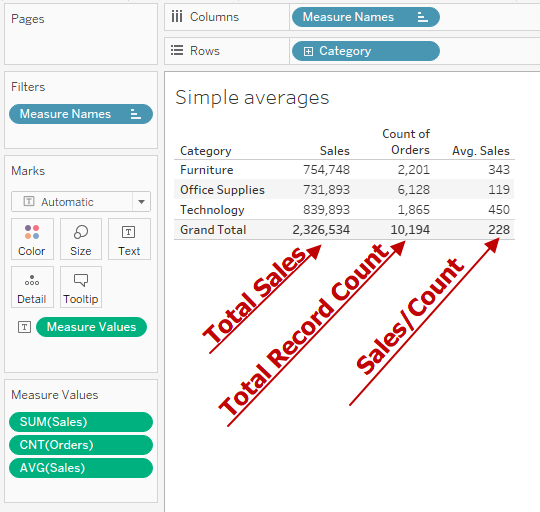
At the row level and Grand Totals, the avg() is the
Sum(Sales)/ Count(records)
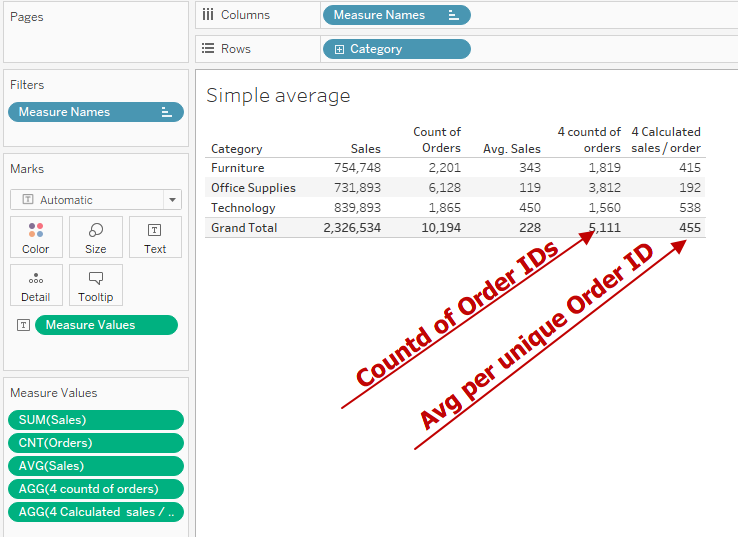
But you may need the average sales per order – to do that you would need
Sum(Sales)/Countd(Order ID)
Often users want to find the average order per day – but need to distinguish between the average per day that there were sales or the average per all the days in the month. The average per total days in the month includes the null (no sales) days as shown below:
First Total days in a month:
datepart('day', datetrunc('month', dateadd ('month',1,([Order Date])))-1)
Number of sales days
countd([Order Date])
Average per sales day
sum([Sales])/[6 Count of Order dates]
Average per total calendar dates
sum([Sales])/min([6 total days in month])
and the result
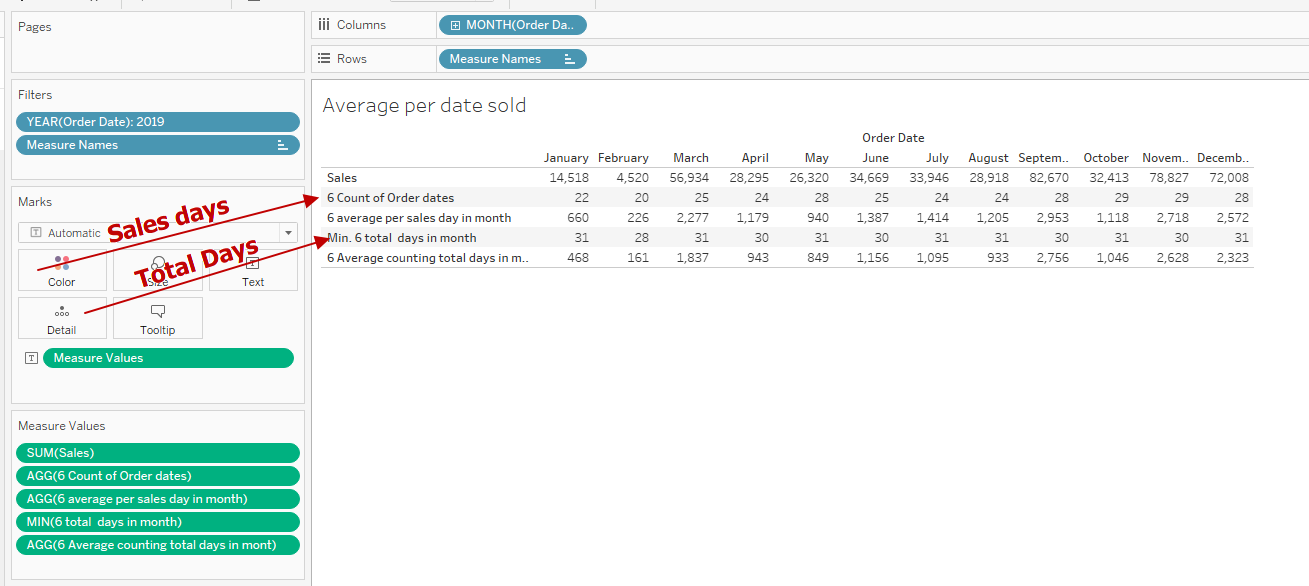
As the designer, you need to determine which average is needed and how to make the proper calculation
4 Totals with Table Calculations
A frequent (and frustrating) question is why don't Grand Totals work with table calculations? Well, they do when they can but sometimes table calculations (like lookups) can not return a value in the Grand Total line.
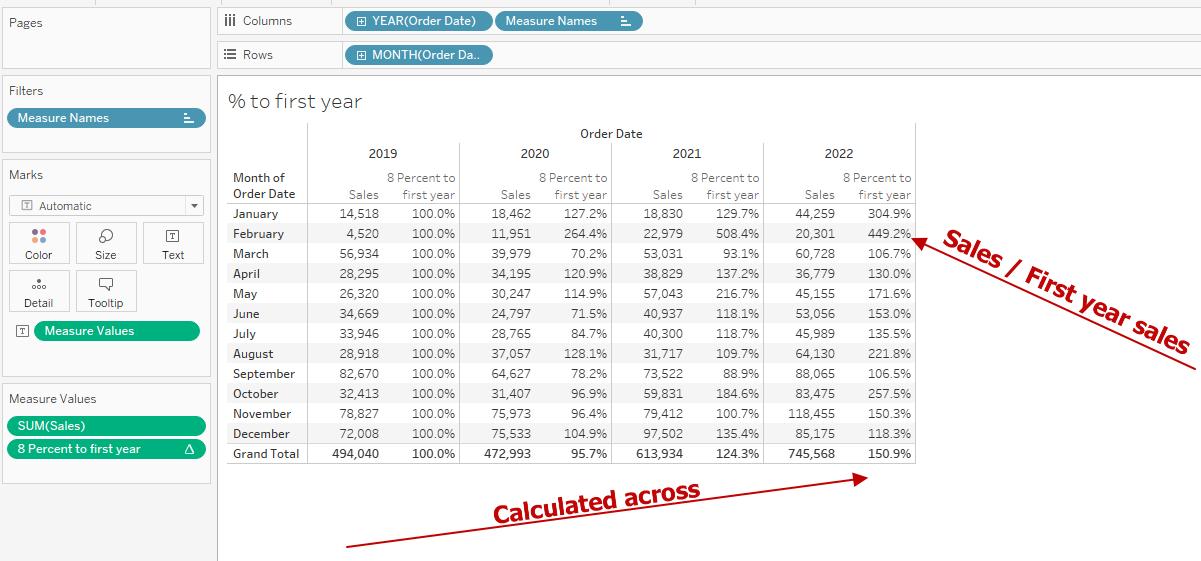
In this example a table calculation determines the percent to the first year across a range of years – the formula is:
sum([Sales])/ lookup(SUM([Sales]),FIRST())
and it returns values at the row and the Grand Total level:
Where this running average calculation can't determine the Grand Total average so it returns the overall total
WINDOW_AVG(SUM([Sales]), -2, 0)
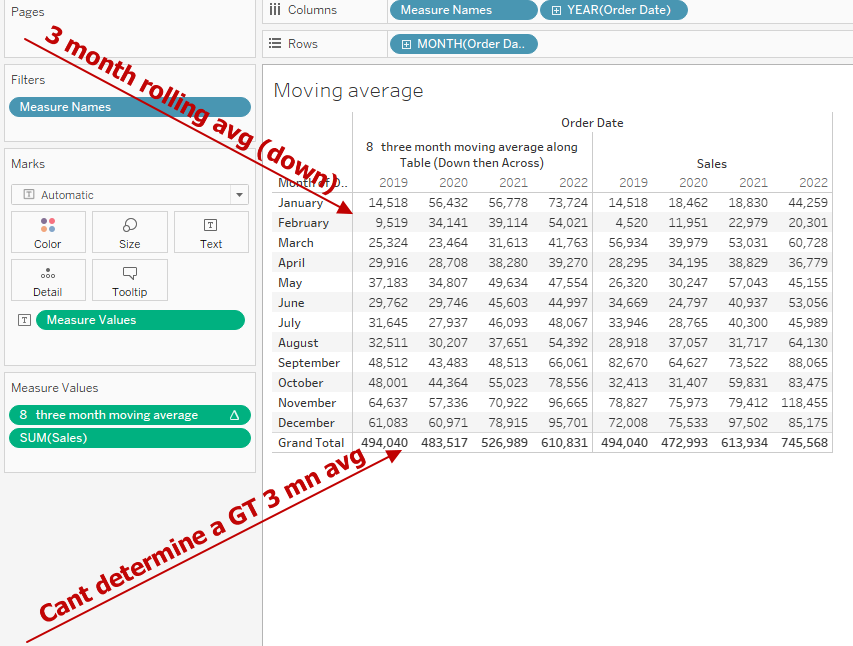
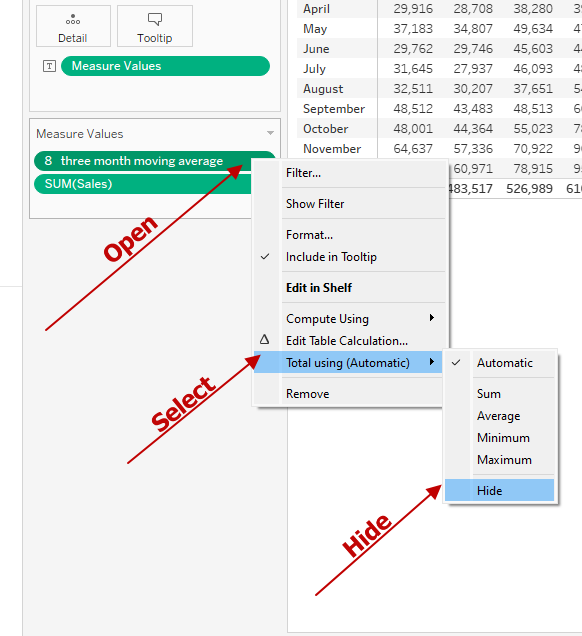
In this case, I would "Hide" the Grand Total to avoid confusion
So what can you do when faced with calculating totals and sub-totals using table calculation – Each case is different. Here are some of the more common ones.
5 Totals for Top N and Others
This one comes up often when users want to find the Top N with the most sales and group all the remainder into a group called Other –
The solution requires nesting table calculations
First the running total sales (I've used a LOD at the Sub-cat level):
RUNNING_SUM(sum([5 LOD of sales by sub cat year ]))
And a Ranking
RANK_UNIQUE(sum([5 LOD of sales by sub cat year ]),"desc")
and use them to apply a label
if [5 Rank LOD sales by sub cat year]<=[N for top N] then attr([Sub-Category]) else "Other" end
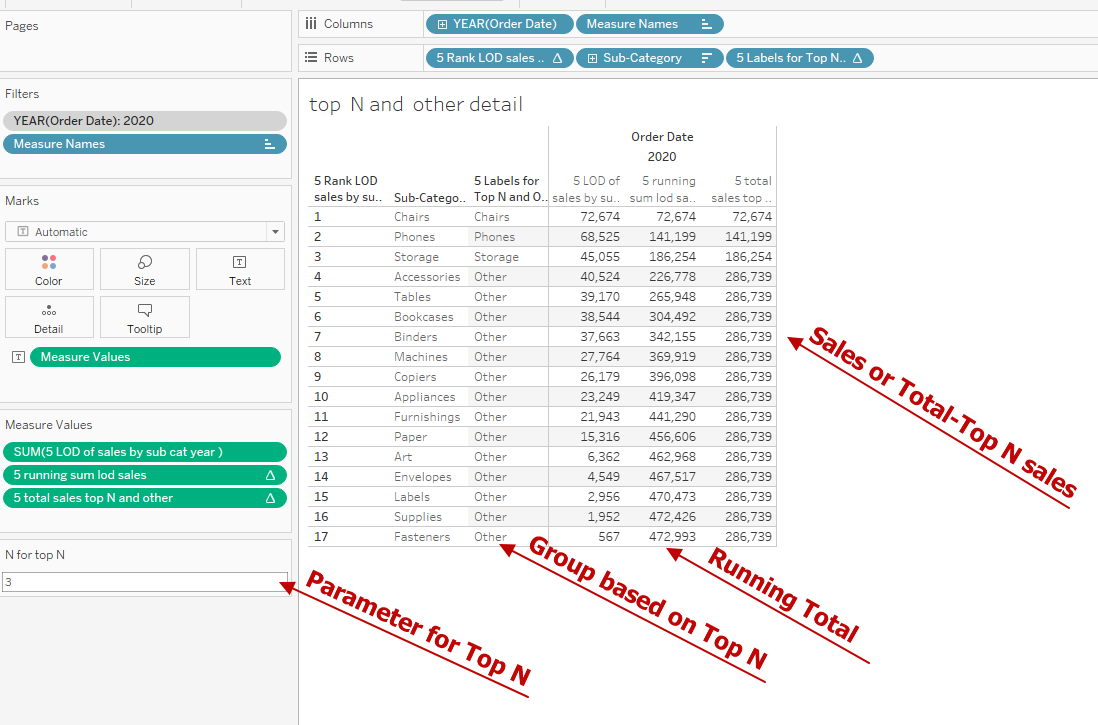
finally, this calculation returns the sub-category total for the Top N and the difference between the fixed Grand Total and the total for the Top N
if [5 Rank LOD sales by sub cat year]<=[N for top N] then running_sum(sum([5 LOD of sales by sub cat year ]))else sum( { FIXED year([Order Date]): sum([Sales])})- window_sum(sum([5 LOD of sales by sub cat year ]),first(),(FIRST()+[N for top N]-1))end
in detail, it returns this
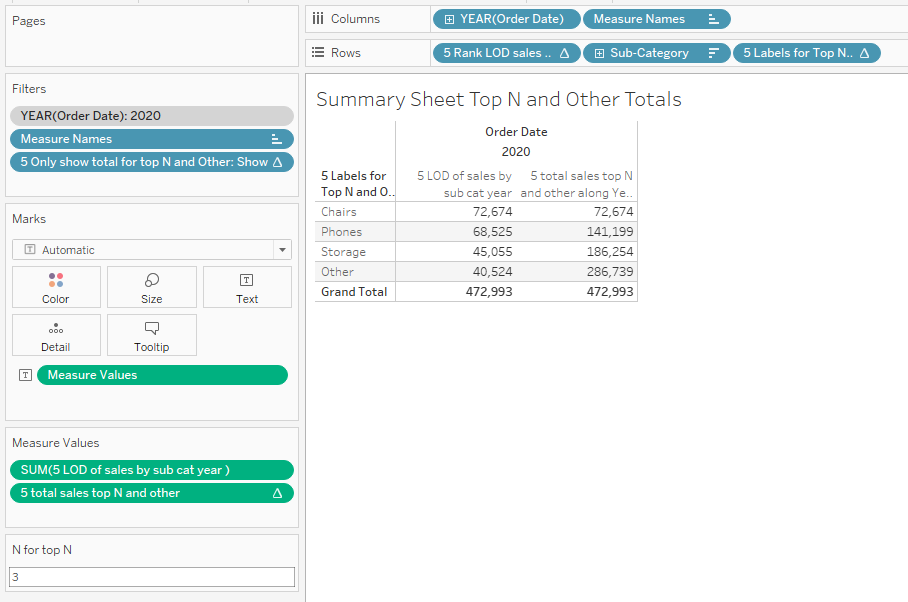
All that is left is to apply a filter to only show the Top N and one of the Other values
if [5 Rank LOD sales by sub cat year]<=[N for top N] OR
[5 Rank LOD sales by sub cat year]=[N for top N]+1 then "Show"
else "Hide" end
and Hide the columns for rank and sub-cate from the view and the result is this
6 Total Time – Duration
Often users want to aggregate time. What they really mean is the difference between the start and end times over a series of events – Not time but duration.
The data source usually looks like this with separate date/time fields:
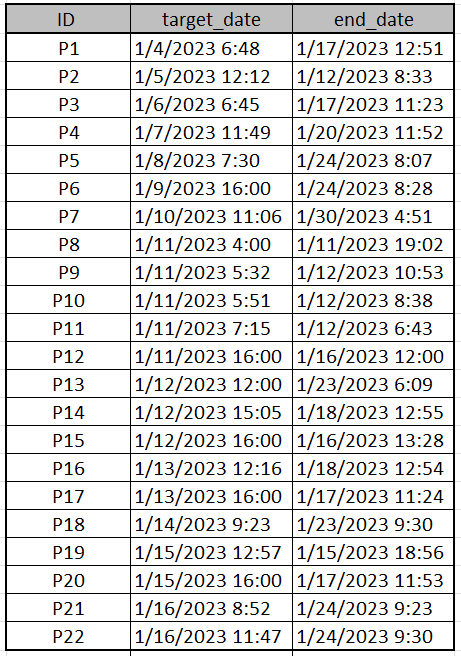
To calculate the total duration you need to start by taking the date difference at the lowest level of the time field (here minutes)
{ FIXED [Process Id]:datediff('minute',Min([Target Date]),Min([End Date]))}
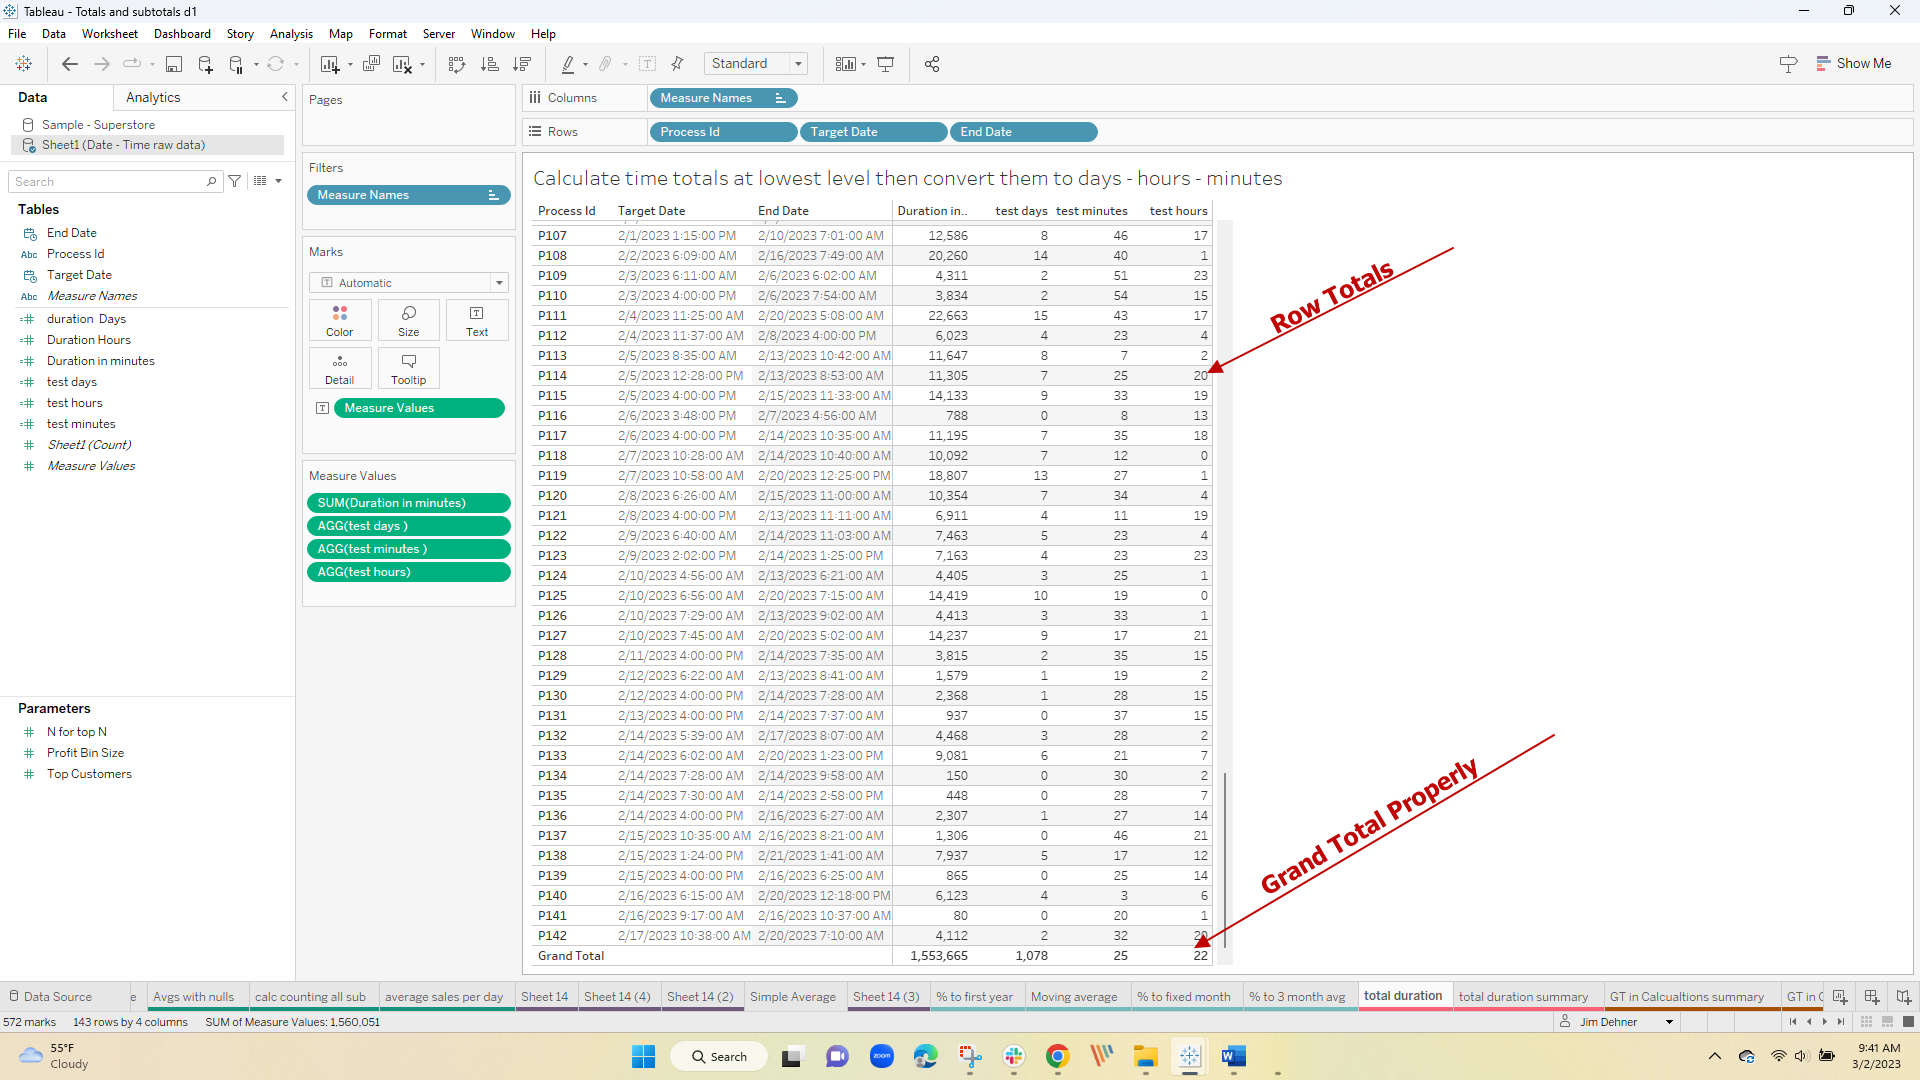
Converting the total number of minutes to days, hours, and minutes which also will total properly with 60 minutes per hour – 24 hours per day requires 3 separate calculations.
Calculating days is the most straightforward
{ FIXED [Process Id]: Int( sum( [Duration in minutes])/(24*60))}
Hours can be found with:
{ FIXED [Process Id]:INT(sum(([Duration in minutes]%(24*60))/60))}
The expression uses a function called Modulo (that is the % sign) and it returns the remainder of dividing the minutes by 24*60
Minutes can be found with:
int(sum({ INCLUDE [Process Id]:sum([Duration in minutes]) }) %60)
At a detail and Grand Total level the calculations total properly:
7 Use Grand Totals and Sub-Totals in other Calculations
This one is a bit more complex. In this example, the user wants to present 3 levels of percentages to total in the same chart.
In detail, the user would like to see the percentage of the Subcategory to the Grand Total, the percentage of the Category to the Segment, and finally the percentage of the Segment to the overall Grand Total
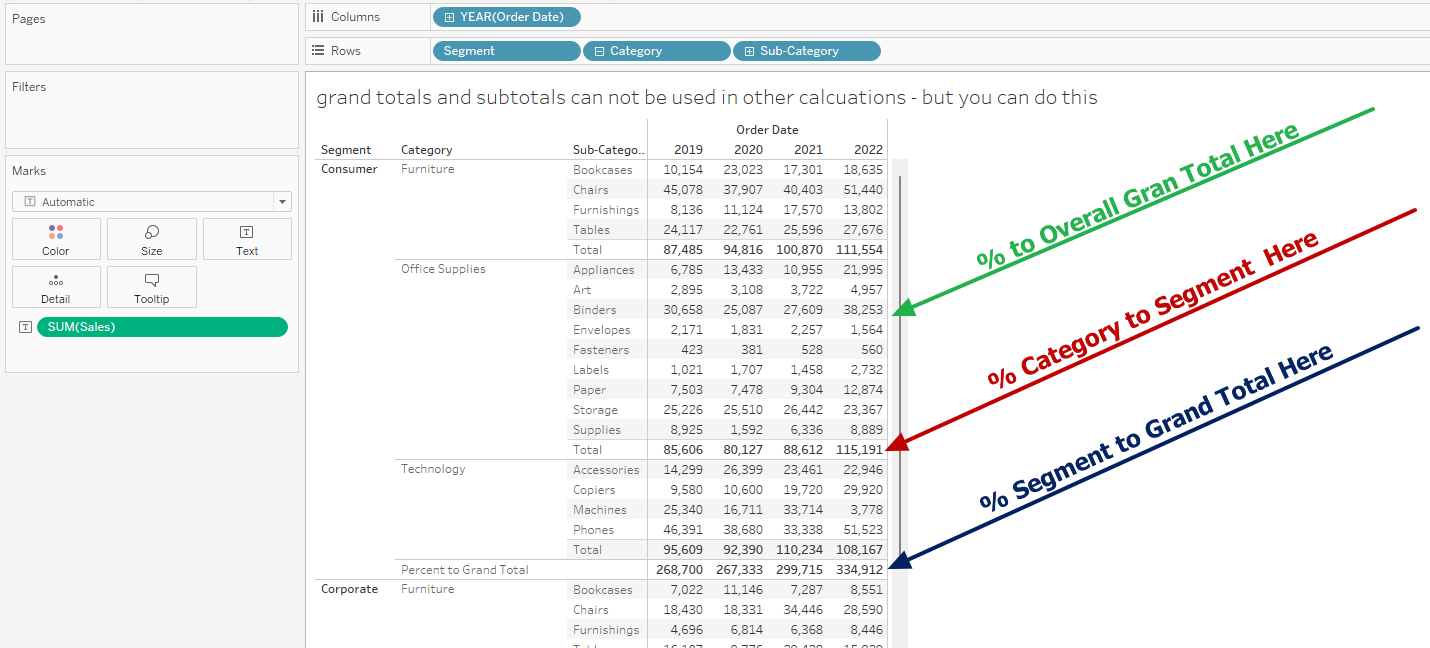
Grand Totals and Sub-Totals can not be used in calculations so we need to use custom totals but there are several levels and we would not be able to use size() =1 as we did previously.
The solution here gets complex but takes advantage of the fact that min() <> max() for a dimension in the Grand Total and Sub Total rows.
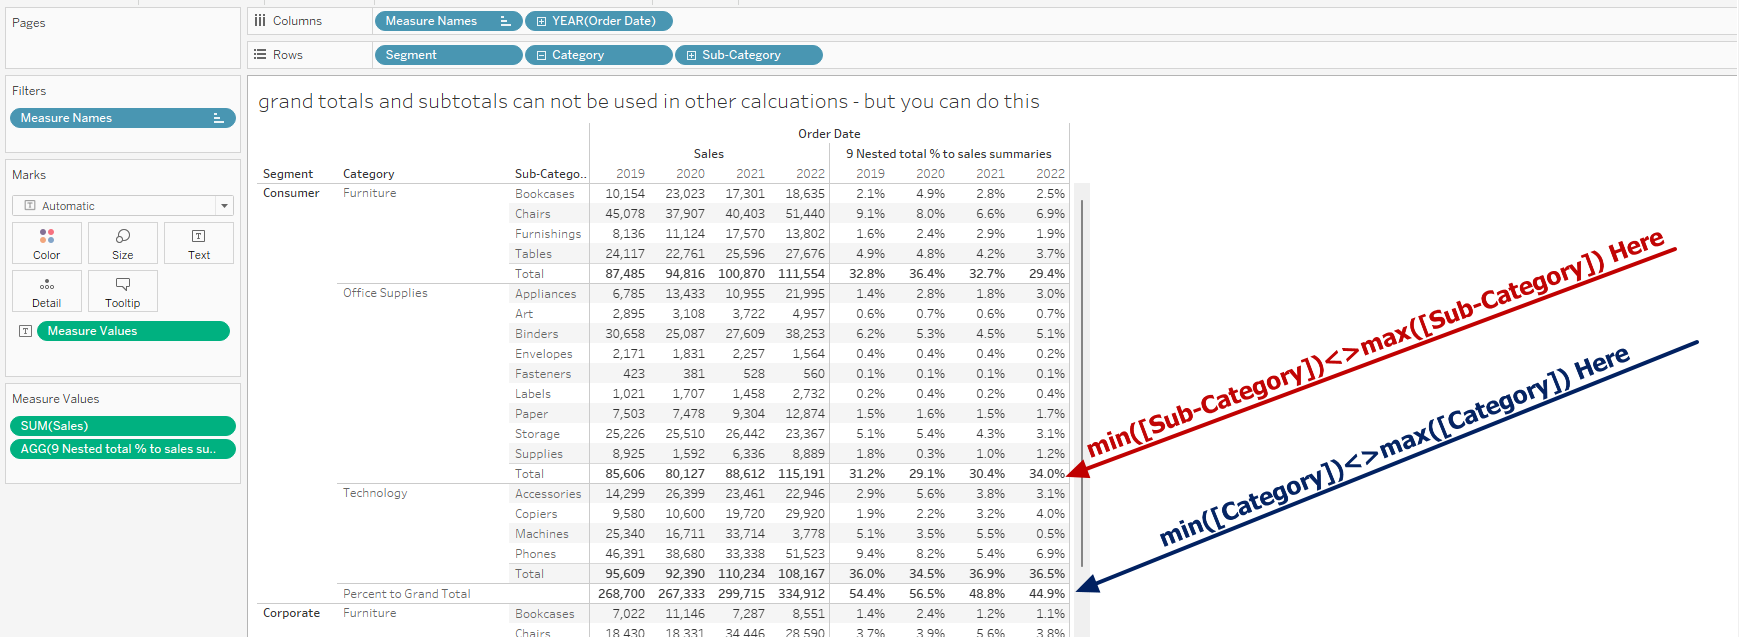
so we can write a complex nested calculation to place the segment and category percentages as defined where we want them and the percentage to total everywhere else
if min([Category])<>max([Category]) then
sum({ FIXED [Segment],YEAR([Order Date]) :sum([Sales])}) / sum({ FIXED year([Order Date]):sum([Sales])})
elseif min([Sub-Category])<>max([Sub-Category]) then
sum({ FIXED [Category],year([Order Date]):sum([Sales])}) / sum({ FIXED year([Order Date]):sum([Sales])})
else Sum([Sales])/sum({ FIXED year([Order Date]):sum([Sales])})
end
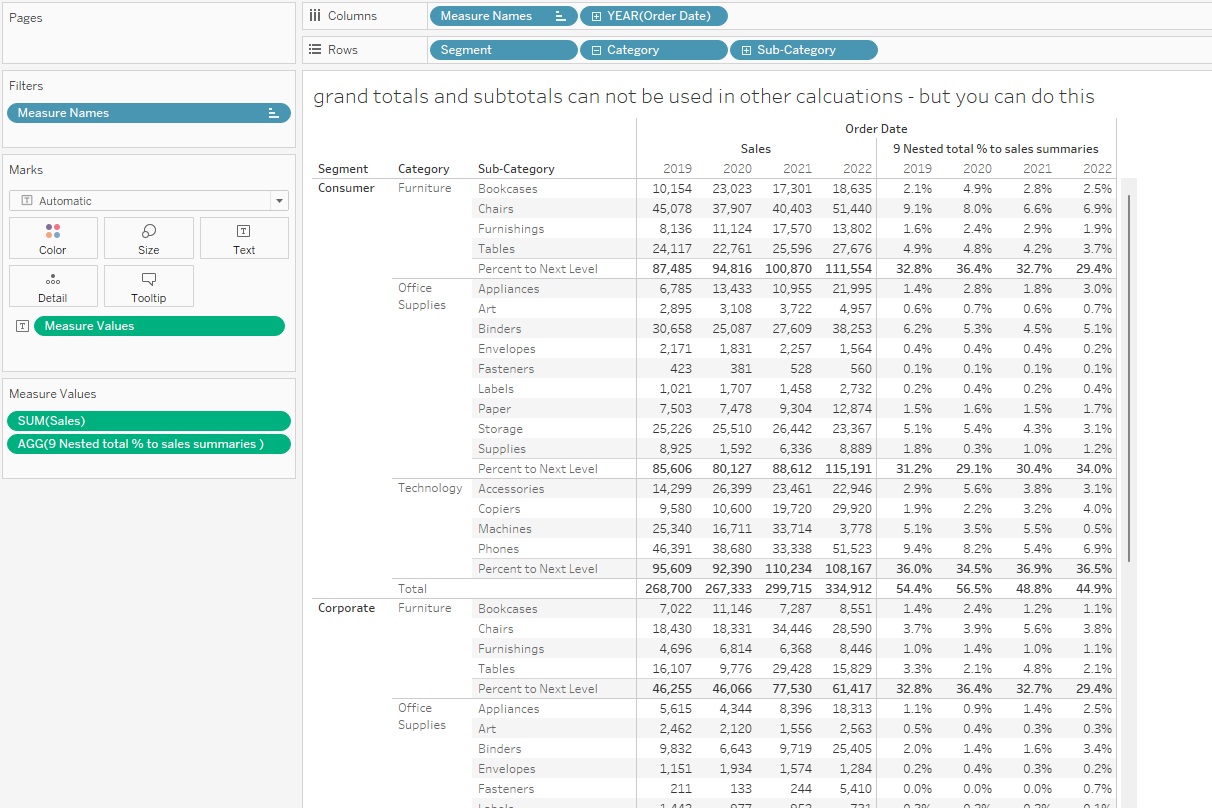
The first clause returns the Segment percentage to the Category total, the second the Category percentage to the Grand Total, and the last is the Subcategory percentages. In chart form, it looks like this:
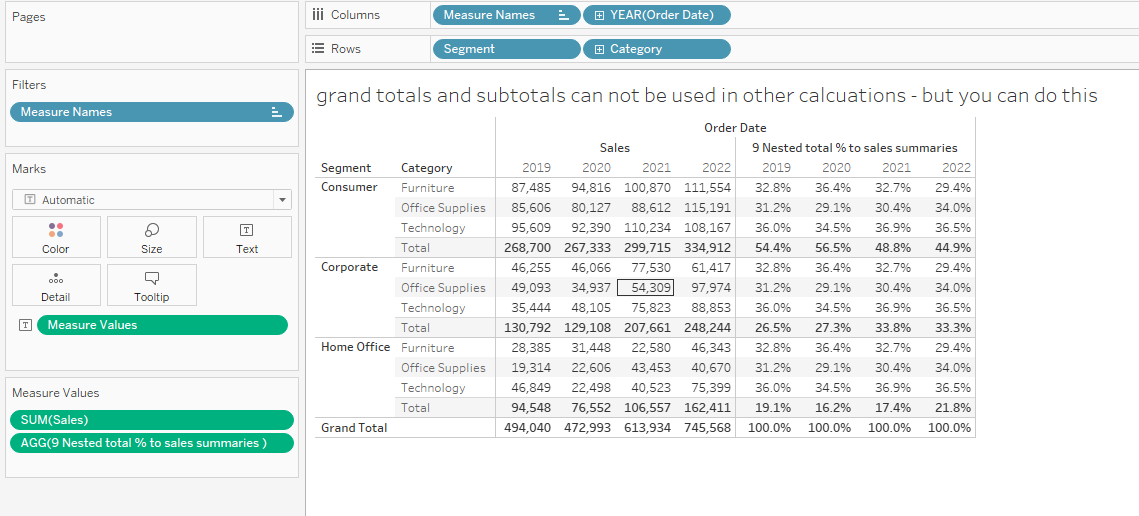
as you close the hierarchy it looks like this
I hope this helped but your situation may be unique. If you have a specific issue, I recommend you post a question on the Community Forums –
The workbook used here can be downloaded at Link to Workbook
see the VizConnect video at GT and ST Video
Jim

2 Responses
a fantastic article. You put lots of effort into this informative article. Thanks, Jim!
Thank you so much for all the effort put into this article and all your Tableau blog posts. I've truly come to enjoy and understand using Tableau so much better. I'm truly grateful.