
The most frequently searched post on my blog is on how to do YoY and YTD calculations. But it only works with actual calendar dates. Those of you who have to use a fiscal calendar face an added problem – Tableau date functions only work with actual calendar dates. Here we will look at how to do period-to-date and period-over-period analysis using your fiscal calendar.
Fiscal calendars are common in many industries where the accounting year begins on a date other than January – For example, in the US many retailers or manufacturers who sell into the retail markets start their fiscal year on February 1 to align with inventory taxes. In those cases, the calculation of typical business metrics becomes much more complex than for those using a calendar year.
Tableau does have an option that allows the user to adjust the FY start:
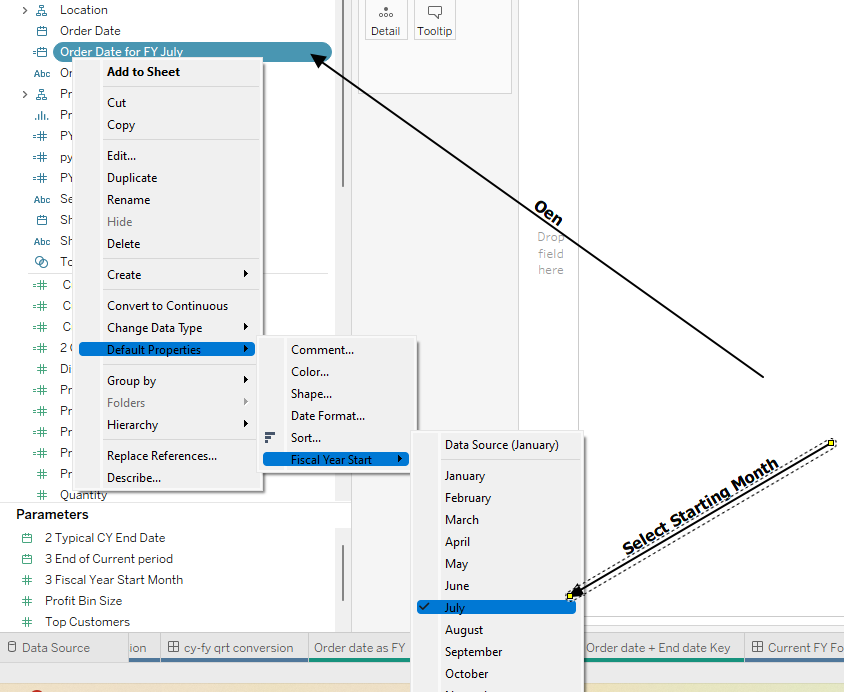
And it works well to create FY tables that can be used in table calculations:

But they do have limitations when used in table calculations:
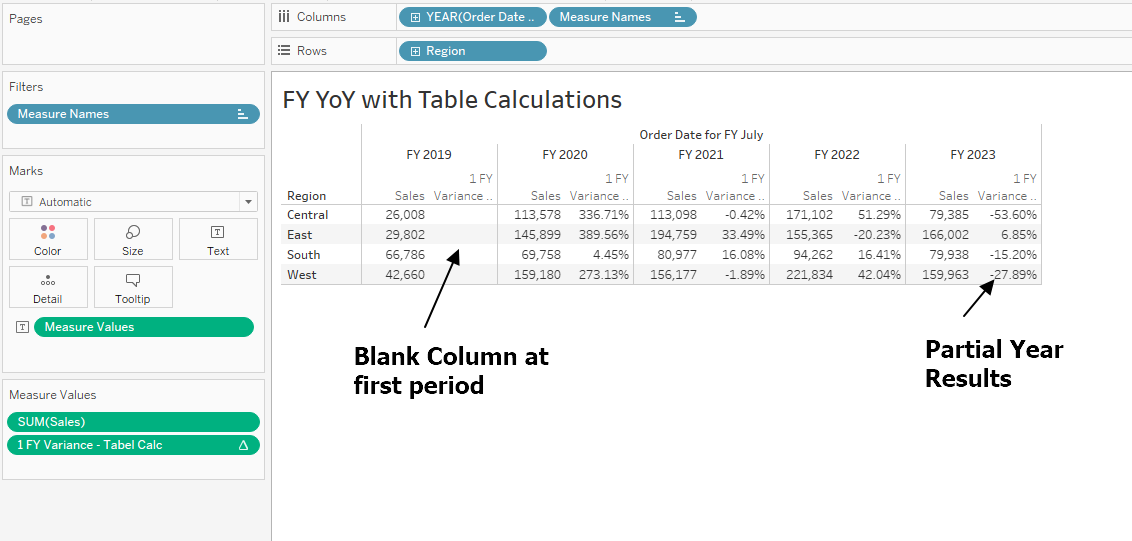
and that is where we run into problems – Many users want to see period-over-period calculations and variances based on YTD, QTD, and MTD which require the use of date functions. Unfortunately, the default fiscal year notations can not be used in date functions. You have to build your own calculations-
While there are other approaches, here I will use a string (text) "key" based on the fiscal year, quarter, month, and day to act in the same way the underlying Tableau calendar date works in date functions. The key used here is 10 characters – FY (4), FQ (2), FM((2) and FD(2) concatenated into a single string. We will leverage the fact that strings are based on numerals sequence and sort the same way actual dates would in Tableau.
1- Ground Rules
- Calculations here are based on an actual date field. If your fiscal period is based on a string you can first convert it to an actual date – see FAQ Series – Fiscal Date –
- The FY and each of the fiscal months start on the 1st of the month. If your fiscal months start on a different day but it is consistent each month you can modify the formulas here (with some work on your part).
- For those who are working with other fiscal calendars (e.g. starts the 5th working day of the month) you will need a different approach.
- The starting month initiates the future year – i.e. a July 2022 start month is at the beginning of FY2023.
2 – The goal
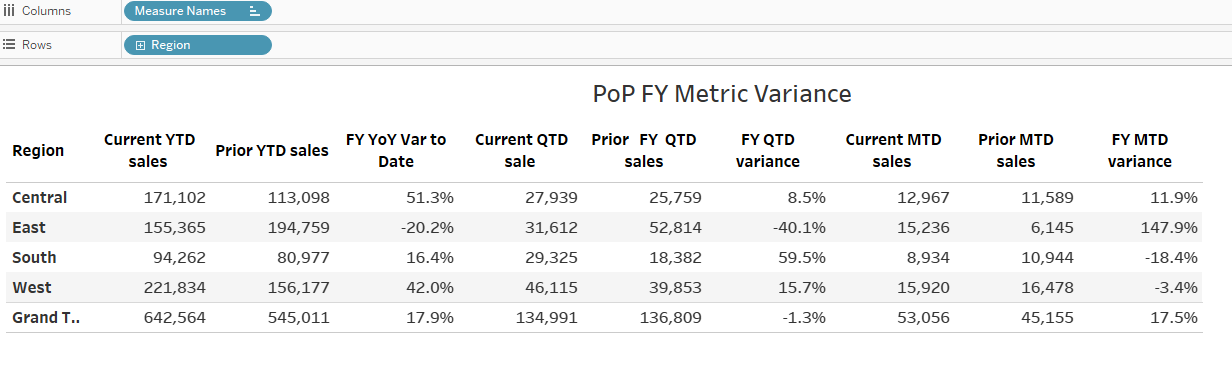
We want to create "to-date" metrics and variances that would fill this table:
We need to set the fiscal year start month (one time only) with a parameter –
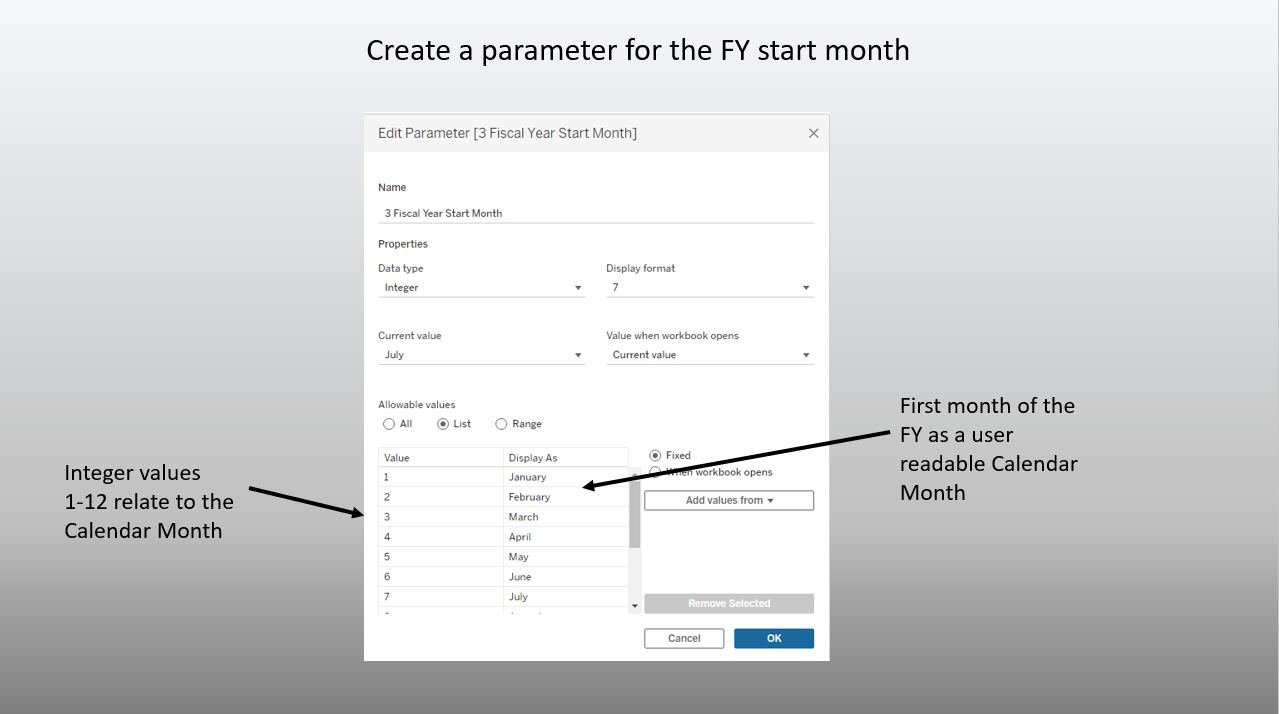
While you may be tempted to use datepart here, please use the parameter – – the formulas that follow are complex and are based on the parameter integer value.
(Note: Downloadable workbook at Link to Workbook – contains all the formulas used here)
3 FY Date Key
The FY date key is a 10-digit string based on the FY, FM, FQ, and FD, It can be calculated with the following formulas
FY
if month([Order Date])<[3 Fiscal Year Start Month] then year([Order Date])
else year([Order Date])+1 end
FM
if month([Order Date])-[3 Fiscal Year Start Month]<0 then (13-[3 Fiscal Year Start Month]+MONTH([Order Date]))
else month([Order Date])-[3 Fiscal Year Start Month] +1 end
FQ (Note – Special thanks to Diego Martinez – Tableau Visionary this formula – much easier than what I first had in here)
DATEPART('quarter', DATEADD('month', 1-[3 Fiscal Year Start Month], [Order Date]))
FD
right("00"+str(datepart('day',[Order Date])),2)
and then this formula to create the actual key
str([FY year])+right('00'+ str([FY quarter]),2)+right('00'+str([FY Month]),2)+[FY day]
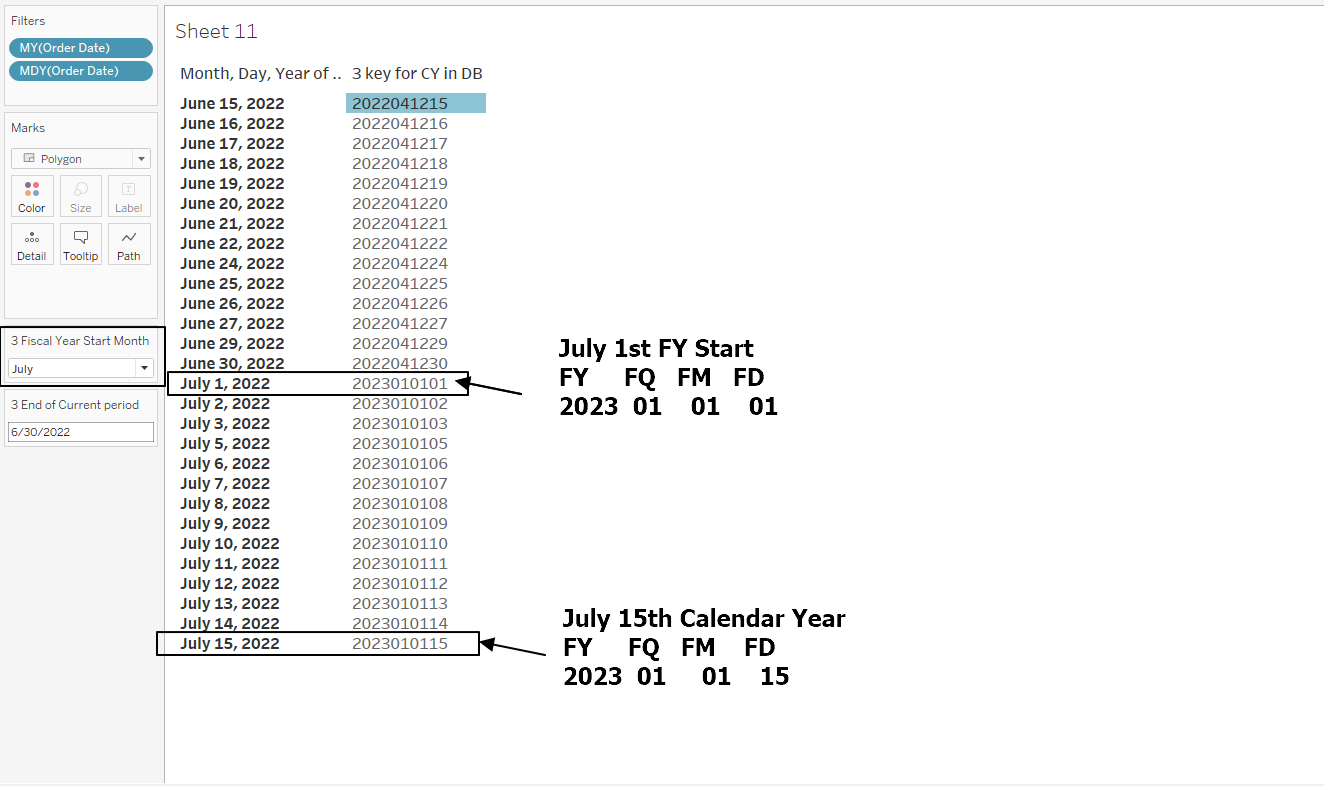
OK, that will convert the actual calendar date to a key that is used in the rest of the analysis. The calendar date/key can be seen in the following example:
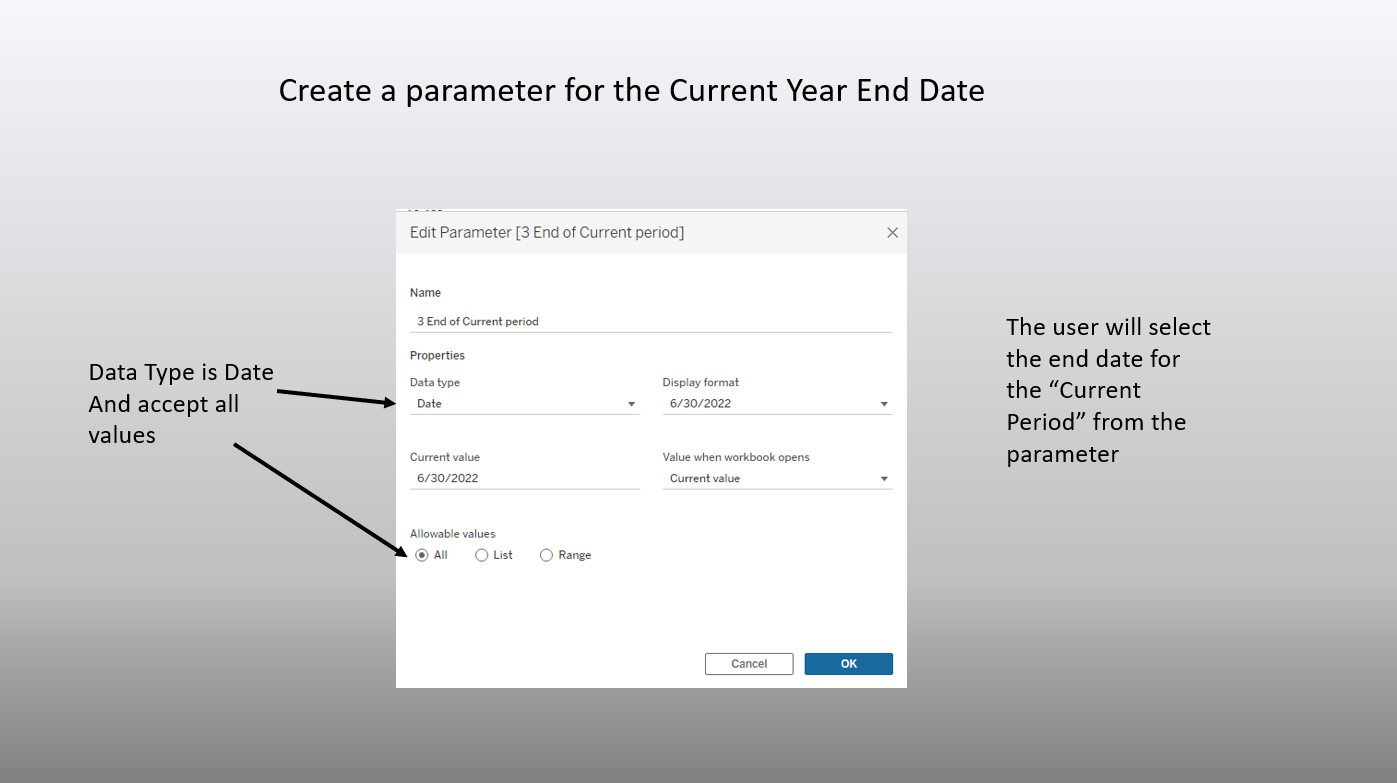
4 End date key used in the analysis
Next, we need to create a parameter the user will use to input the end date for the analysis. It is just a straightforward date parameter that accepts any date
and you create another set of FY, FM, FQ, and FD based on the parameter – I will not post the formulas here – you can copy them directly from the workbook.
They are used to create a single End Date Key
str([FY current end year])+right('00'+ str([FY current end date Q]),2)+right('00'+str([FY current end date M]),2)+[FY current end date Day]
5 Current year metric formulas
Now that you have an end date key in terms of the fiscal calendar the YTD, MTD, and QTD can be calculated by totaling all the sales (or other measures) from the start of the period to the end date using the following
Current YTD
if [FY year] = [FY current end year] and
[3 key for CY in DB]<=[ Key for current FY end date] then [Sales]end
Current MTD
if [FY year] = [FY current end year] and
[FY Month]= [FY current end date M] and
[3 key for CY in DB]<=[ Key for current FY end date] then [Sales] end
Current QTD
if [FY year] = [FY current end year] and
[FY quarter]=[FY current end date Q] and [3 key for CY in DB]<=[ Key for current FY end date] then [Sales] end
As written the formulas are regular calculated fields. If in your analysis you need results unique to specific segments, divisions, or regions you can encase the expressions in Fixed LODs.
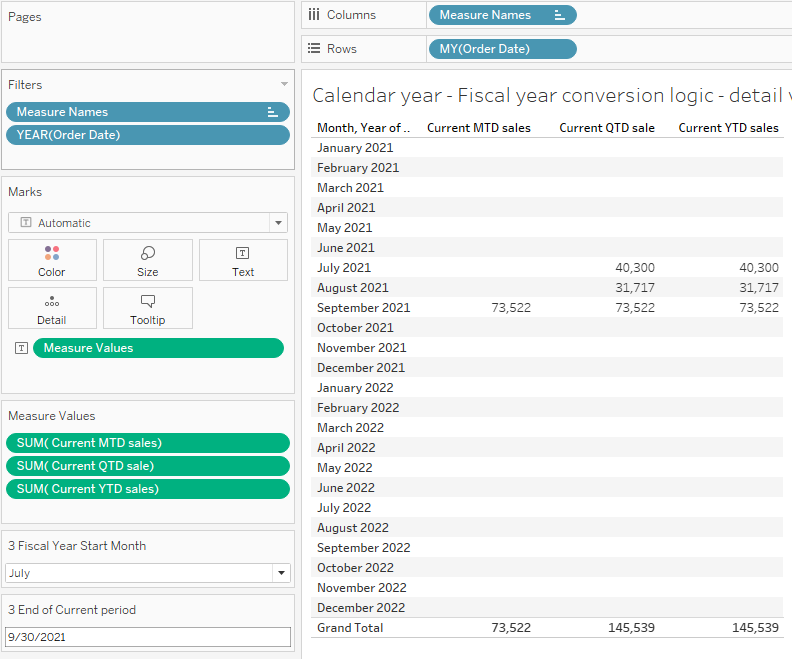
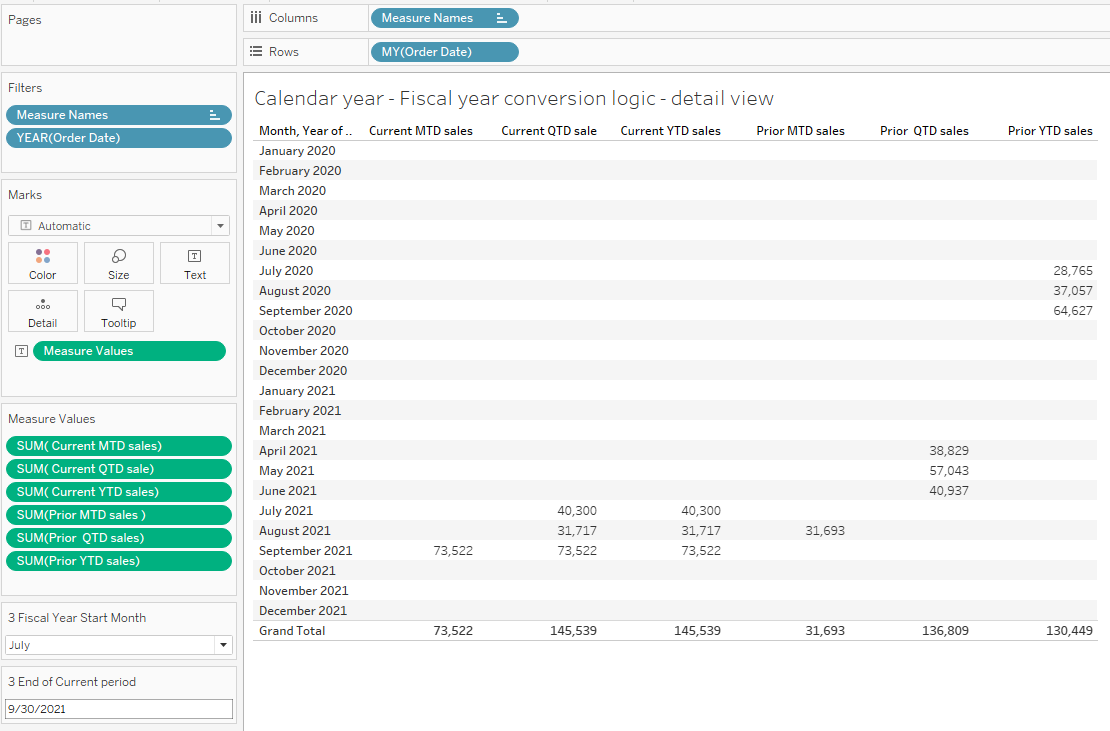
Based on a Sept 30, 2021 end date and a July FY start month the detailed results for YTD, MTD, and QTD are:
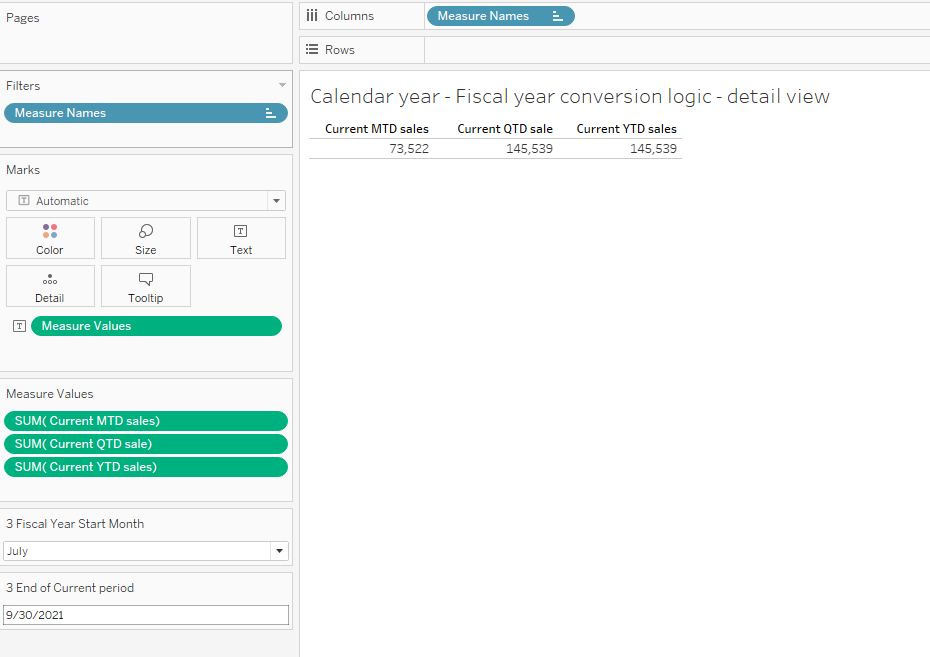
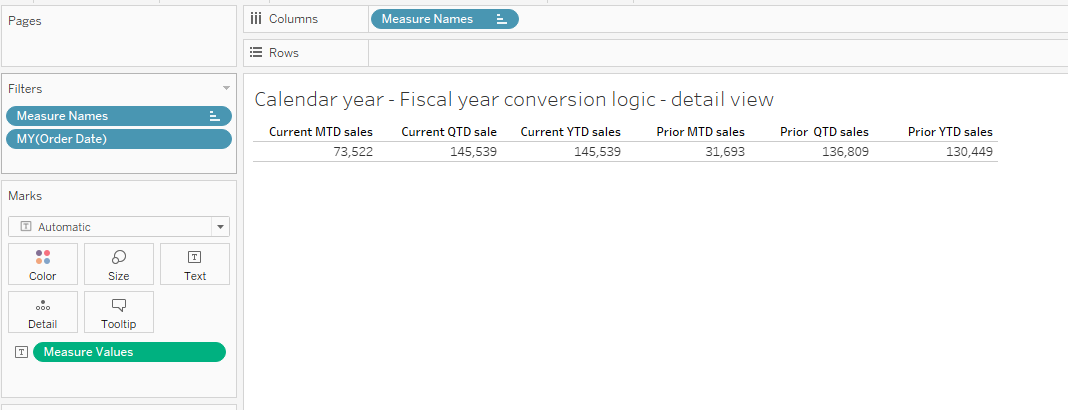
Which can be summarized to:
6 Prior year metrics
The calculations for the prior period's metrics are similar just slightly more complex.
Starting with the prior year-end date key the formula is:
str([FY current end year]-1)+right('00'+ str([FY current end date Q]),2)+right('00'+str([FY current end date M]),2)+[FY current end date Day]
The Prior FY is:
[FY current end year]-1
Now the metric totals are
Prior YTD Sales
if [FY year] = [FY Prior end year] and [3 key for CY in DB]<=[ Key for prior FY end date] then [Sales] end
Prior MTD Sales:
if [FY current end date M] =1 then
(if [FY year] = [FY Prior end year] and
[FY Month]=12 and
[Order Date]<=dateadd("month",-1,[3 End of Current period])
then [Sales] end)
else
(if [FY year] = [FY current end year] and
[FY Month]=[FY current end date M]-1
and [Order Date]<=dateadd("month",-1,[3 End of Current period])
then [Sales]
end) end
Prior QTD:
if [FY current end date Q] =1 then
(if [FY year] = [FY Prior end year] and
[FY quarter]=4 and
[Order Date]<=dateadd("quarter",-1,[3 End of Current period])
then [Sales] end)
else
(if [FY year] = [FY current end year] and
[FY quarter]=[FY current end date Q]-1
and [Order Date]<=dateadd("quarter",-1,[3 End of Current period])
then [Sales]
end) end
They will return the following in detail:
which can be summarized to:
There are 2 additional commonly used metrics for the same period in the prior fiscal year
The formula for the same month prior year is
if [FY year] = [FY Prior end year] and
[FY Month]=[FY current end date M] and[FY day]<=[FY current end date Day]then [Sales] end
and for the same quarter in the prior year is
if [FY year] = [FY Prior end year] and
[FY quarter]=[FY current end date Q] and[Order Date]<=dateadd("year",-1, [3 End of Current period])then [Sales] end
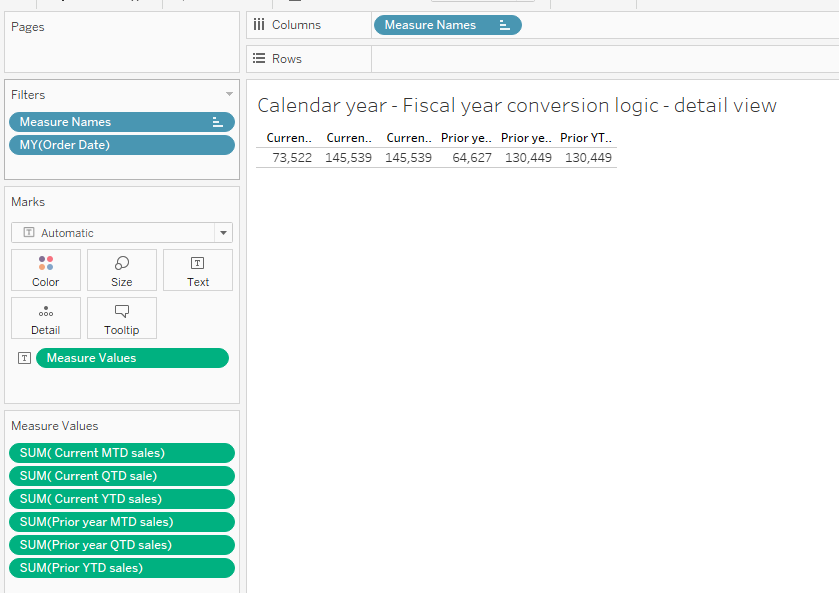
In detail they return this

and in summary:
7 Calculate the variance
All that is left to do is calculate the variance (QTD example):
(sum([ Current QTD sale])-sum([Prior QTD sales]))/sum([Prior QTD sales])
See the workbook for the other equations:
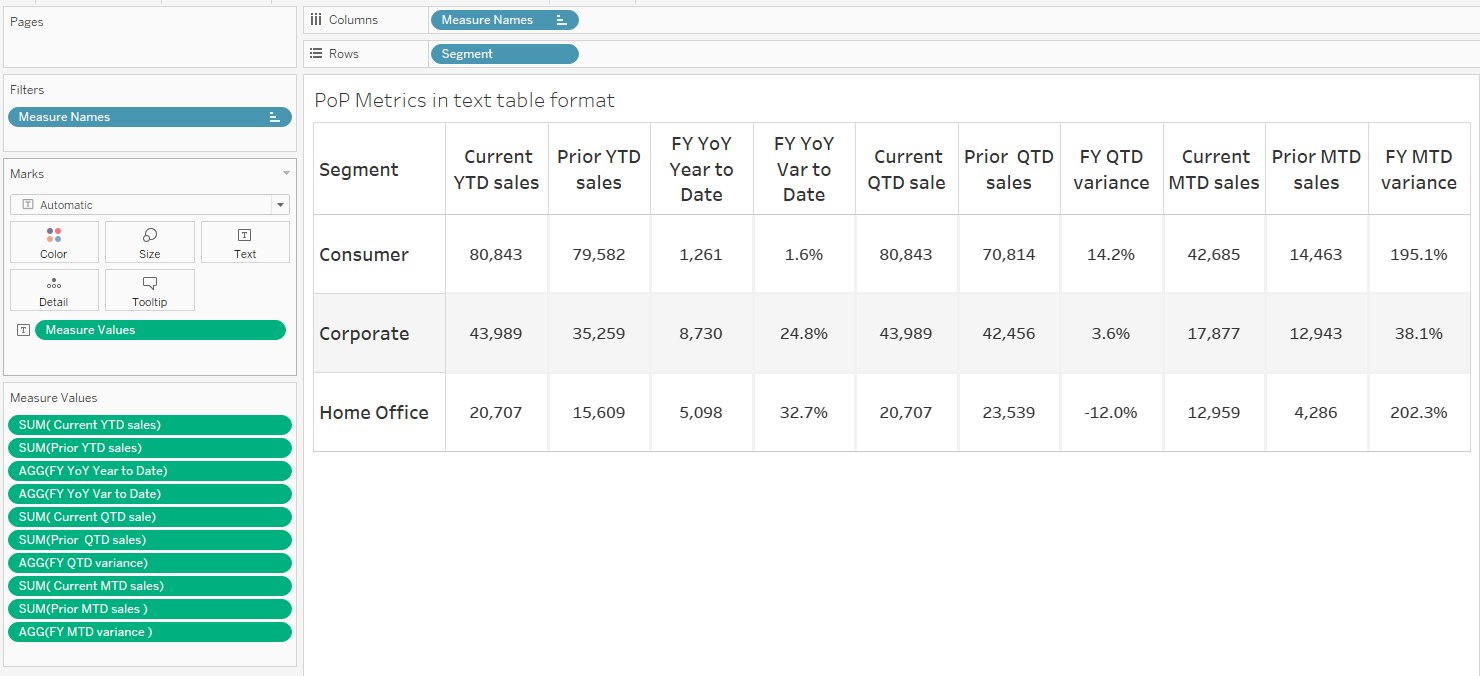
and the results can then be presented in text table form as
I hope this helps you understand the complexity of doing period-over-period calculations based on fiscal years.
The good news is the workbook containing all the formulas can be downloaded from my Tableau Public site at Link to Workbook
It is complex but you can do it!!!!
Jim
