
Occupancy and Turnover Rates and Lost customers
We see a lot of questions on the Forums on calculating occupancy and turnover rates or scheduling meeting rooms and identifying lost customers. They may sound like different problems but the solutions are very similar and require joining base data with a date scaffold or to a copy of itself. Each has a data set that includes a partial date dimension and a means to determine an end time, duration, or period but does not have a calendar or continuous timeline to track progress.
Let's see how it is done:
1 –Hotel Occupancy Rate
The data set includes a “Check in date” and a Duration and asks to determine the occupancy rate by month. The rate is defined as the Count of Days Occupied / Total Count of Days Available.
We need to determine for each room when the room is occupied and then compare that to the total day available in the month – The Check In date is the start of the stay and the Check-in date + the Length of Stay is the end date – but we still will need a calendar to count the occupied days across all rooms –
For that, we add a date scaffold – just a simple spreadsheet with all the dates in the date range –
that is joined to the base date with the join clause shown below:
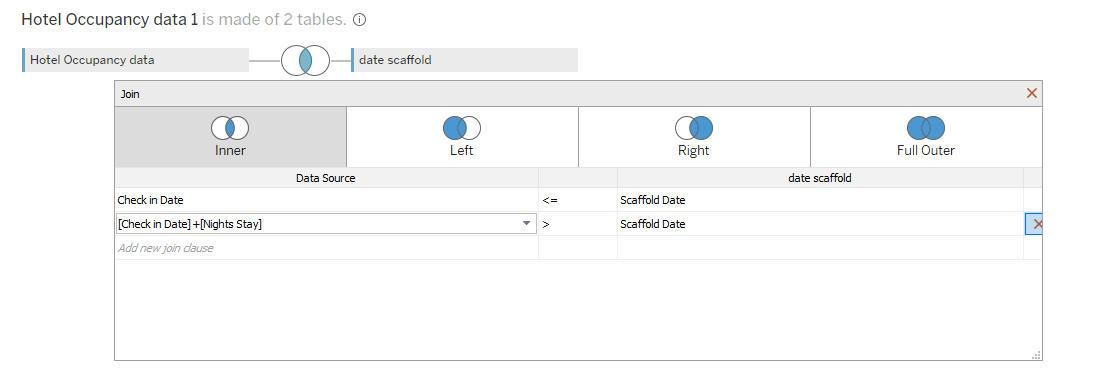
The scaffold is the “Calendar” needed and using in-equalities, we join the Occupancy Data to that calendar from the check-in date to the check-in + Length of stay for each record in the data.
The count formula is a LOD:
{ FIXED [Room Number1] ,[Scaffold Date]: COUNT([ Hotel Occupancy data 1])}
The number of days the room is available is just the number of days in a month and can be calculated as:
{ FIXED [Room Number1],DATEPART('month', [Scaffold Date]): min( datepart('day', datetrunc('month',dateadd('month',1,[Check in Date]))-1 ))}
And then finally the rate is:
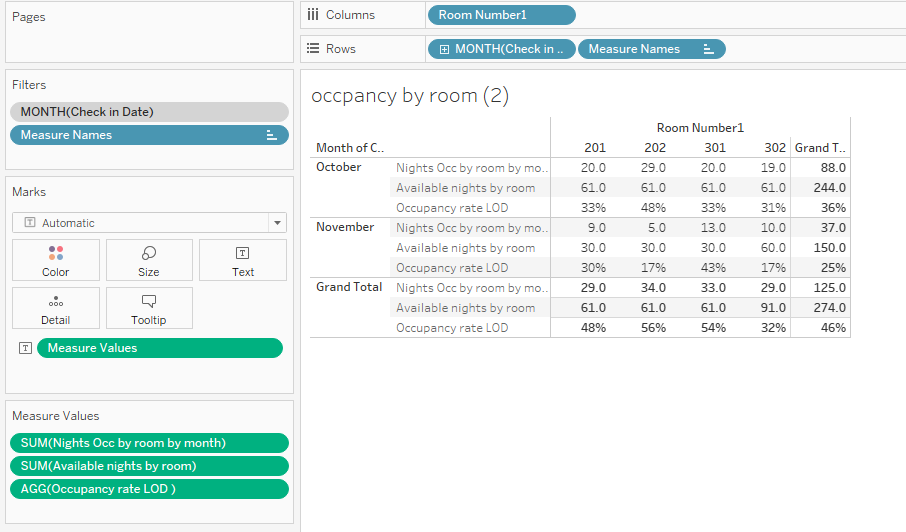
sum([Nights Occ by room by month])/sum([Available nights by room])
The immediate reaction might be why complicate the calculations with the scaffold and the LODs – the data is presented with a check-in date and a duration which may result in a range that spans the month's end. The scaffold allows us to look at and count each date individually and the LOD breaks out each room.
The end result would look like this
2 Meeting Room Availability
A variation of the occupancy rate problem is to determine when individual meeting rooms are available or occupied. There are 2 twists – the room is booked as a start time based on the hour or half-hour and the duration is coded in minutes.
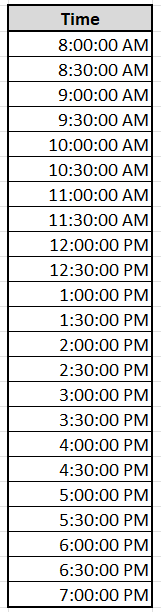
While the approach is the same, there is a mixture of hours and minutes across the available working day 8:00 AM – 7:00 PM in this example. Here the scaffold is a time scaffold
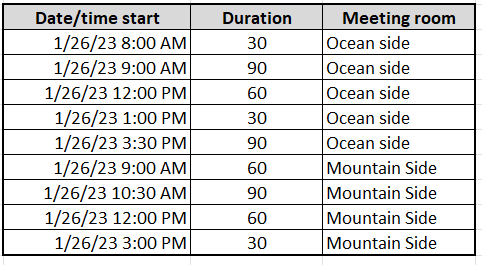
The meeting room base data looks like this:
So we have a scaffold that is just time without a date and meeting room data that does not include all the times. We need to join the 2 with the Cartesian join below:
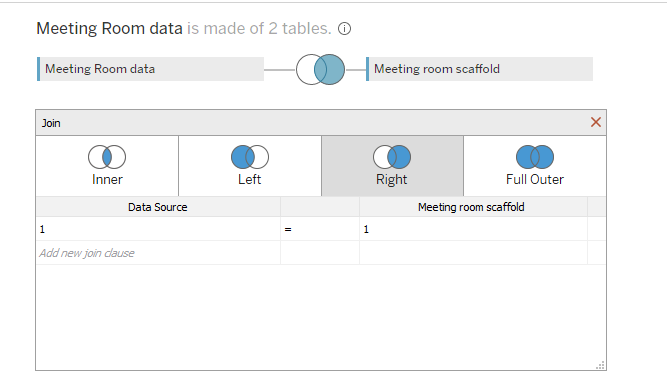
Which connects each record in the “Meeting Room Data” set with every record in the Scaffold.
Now we need to create a Date/Time dimension using the date from the base data and each of the times from the scaffold –
MAKEDATETIME({ FIXED :date( min([Date/time start])) },[Scaffold Time])
Next, create 2 LODs for the Meeting Start and End Times:
Start time
{ FIXED [Meeting room],[Date/time start] :min([Date/time start])}
End time
{ FIXED [Meeting room],[Date/time start] :min( dateadd("minute",[Duration in minutes], [Date/time start]))}
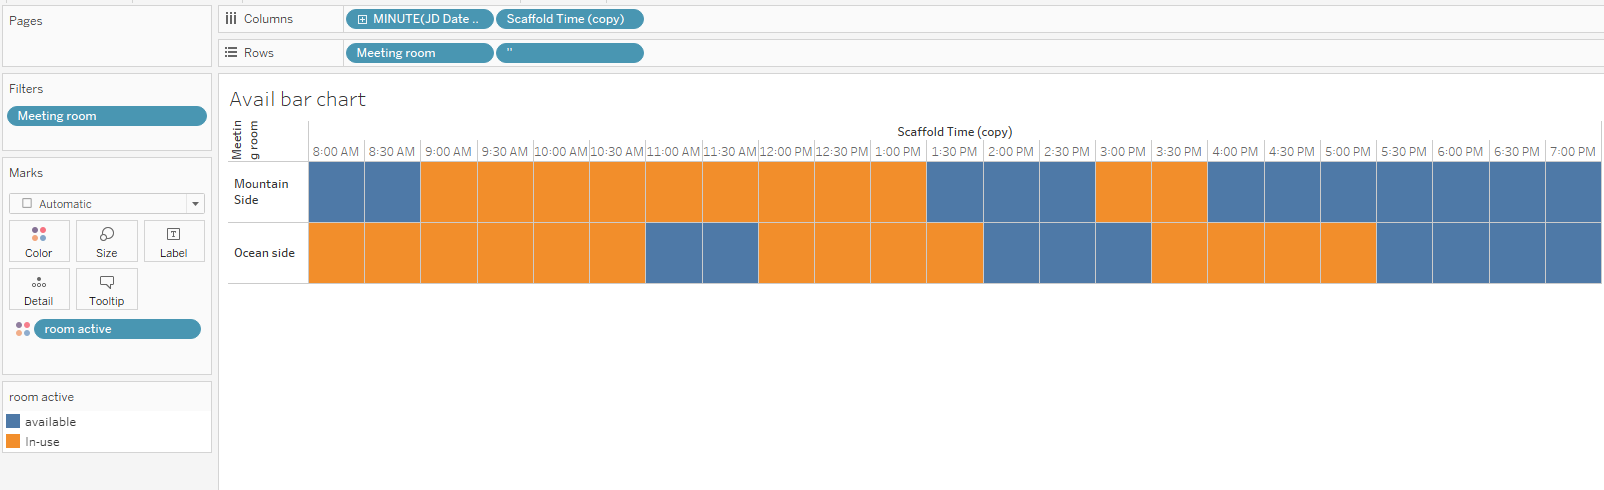
And then a LOD will divide the timeline into Occupied and Available periods
{ FIXED [Meeting room] , DATETRUNC('minute', [JD Date + Scaffold Time]):Min( if DATETRUNC('minute', [JD Date + Scaffold Time])>= [meeting start lod] and [JD Date + Scaffold Time]<=[meeting end lod] then "In-use" else "available" end )}
The resulting schedule would look like this:
3 Employee Turnover Rate
Human Resources departments have a measure to determine employee turnover and, as you might guess, companies have slightly different definitions of turnover. Here we are going to look at an example of a monthly turnover rate defined as the number of employees terminated in the month divided by the number at the start of the month plus those hired during the month.
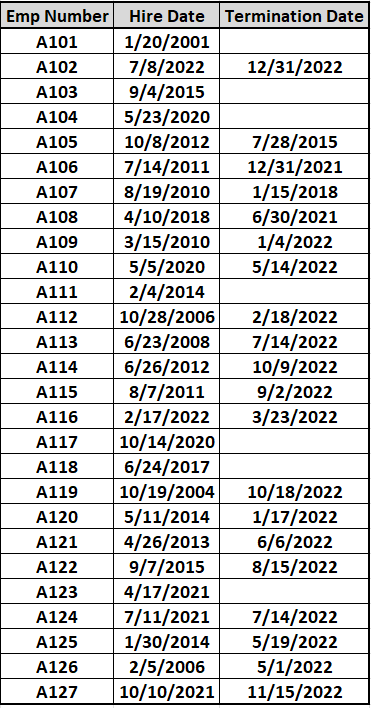
The employment data is just the Hire Date and Termination Date if there is one for each employee. It looks like this:
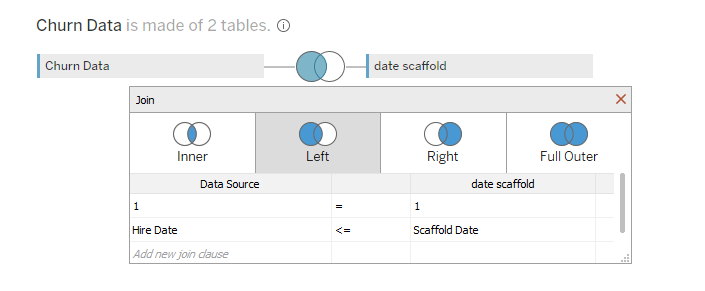
We need to use a Cartesian join to connect the employment data file to a date scaffold that is a simple excel file with every date of 2022
The join clause is:
There are 4 calculated fields:
The count of Active Emps and the first of the month
countd(if datetrunc("month",[Hire Date])<DATETRUNC("month", [Scaffold Date]) and isnull([Termination Date]) or datetrunc("month",[Hire Date])<DATETRUNC("month", [Scaffold Date]) and datetrunc("month",[Termination Date])>=DATETRUNC("month", [Scaffold Date]) then[Emp Number] end )
The count of Emps Terminated in the month
countd( if datetrunc("month",[Termination Date])=DATETRUNC("month", [Scaffold Date]) then[Emp Number] end )
The count of Emps Hired in the month
countd( if datetrunc("month",[Hire Date])=DATETRUNC("month", [Scaffold Date]) then[Emp Number] end )
the Turnover rate
([Employee is term in month]) / ([Employee is active on first of month]+([Emps Hired during month ]))
The result as a text table is:
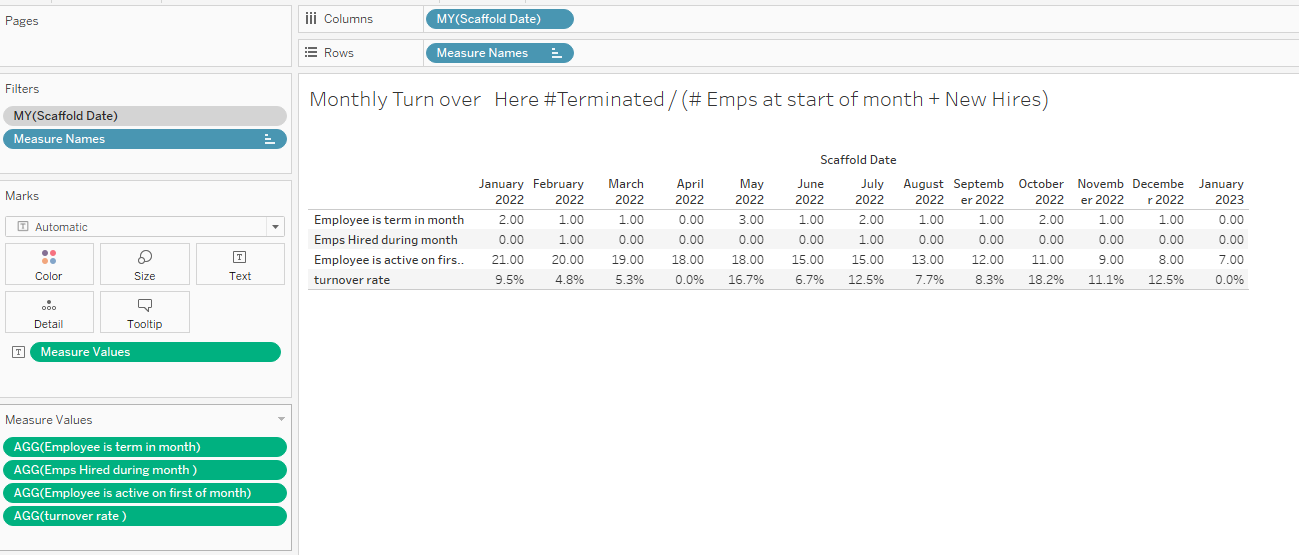
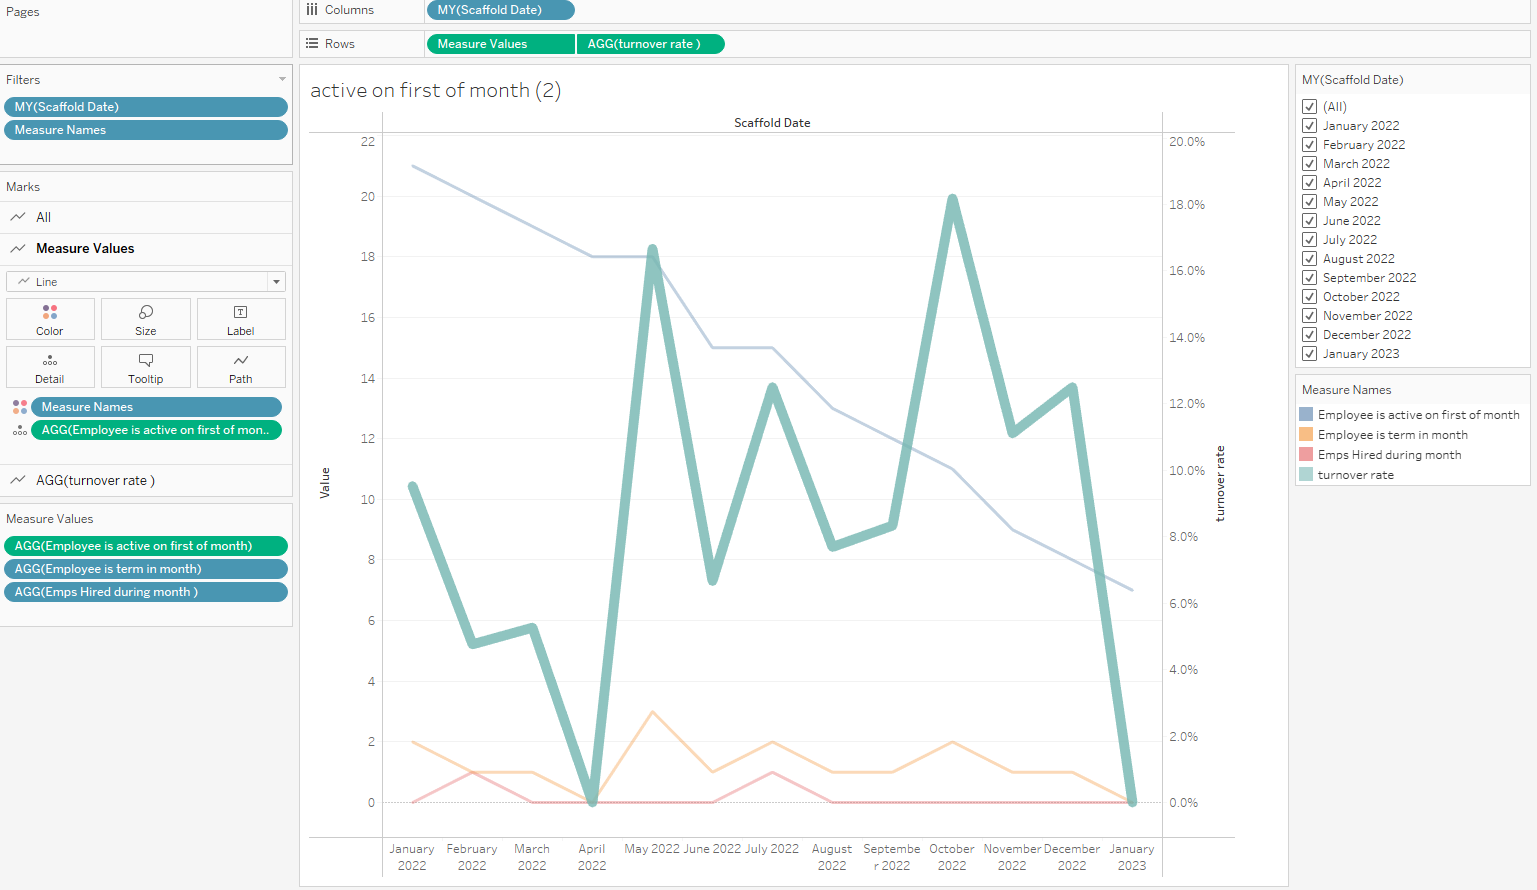
Or as a line chart
4 Lost Customer
Sales departments like to identify lost customers – customers that have not purchased in a long time. Here, using Superstore data, we will find the customers that have not purchased in 2022 but did have purchases in 2021.
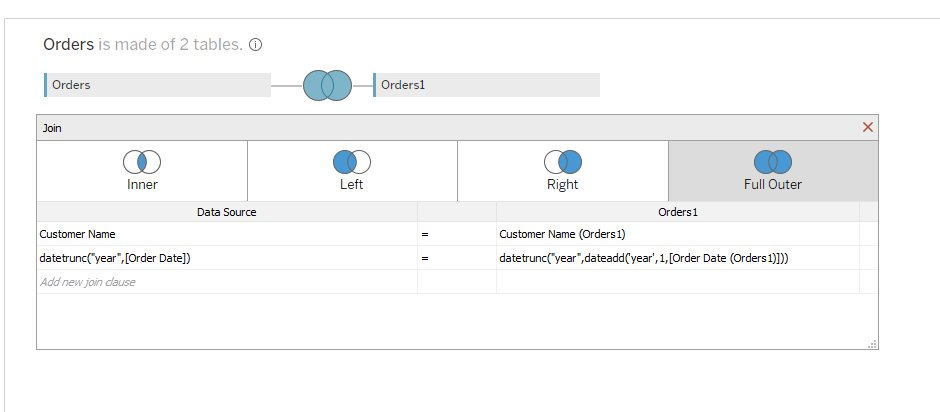
The process is similar to the scaffolding but we won’t need the Cartesian join. We will just make a self-join between the data and a copy of itself but offsetting the order date by 1 year. The join clause looks like this:
Start by creating a TF filter that is True when the Customer had sales in 2021 but did not in 2022:
Where Sales (Orders1) comes from the copy of the data set and Sales are from the original data
sum([Sales (Orders1)])>0 and isnull(sum([Sales]) )
The filter eliminates customers that had sales in both years identifying customers that only had sales in either 2021 or 2022
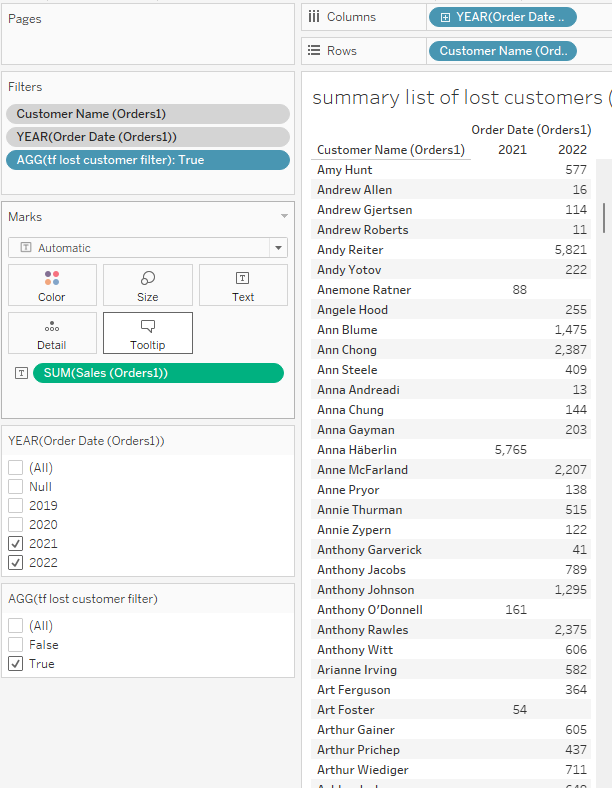
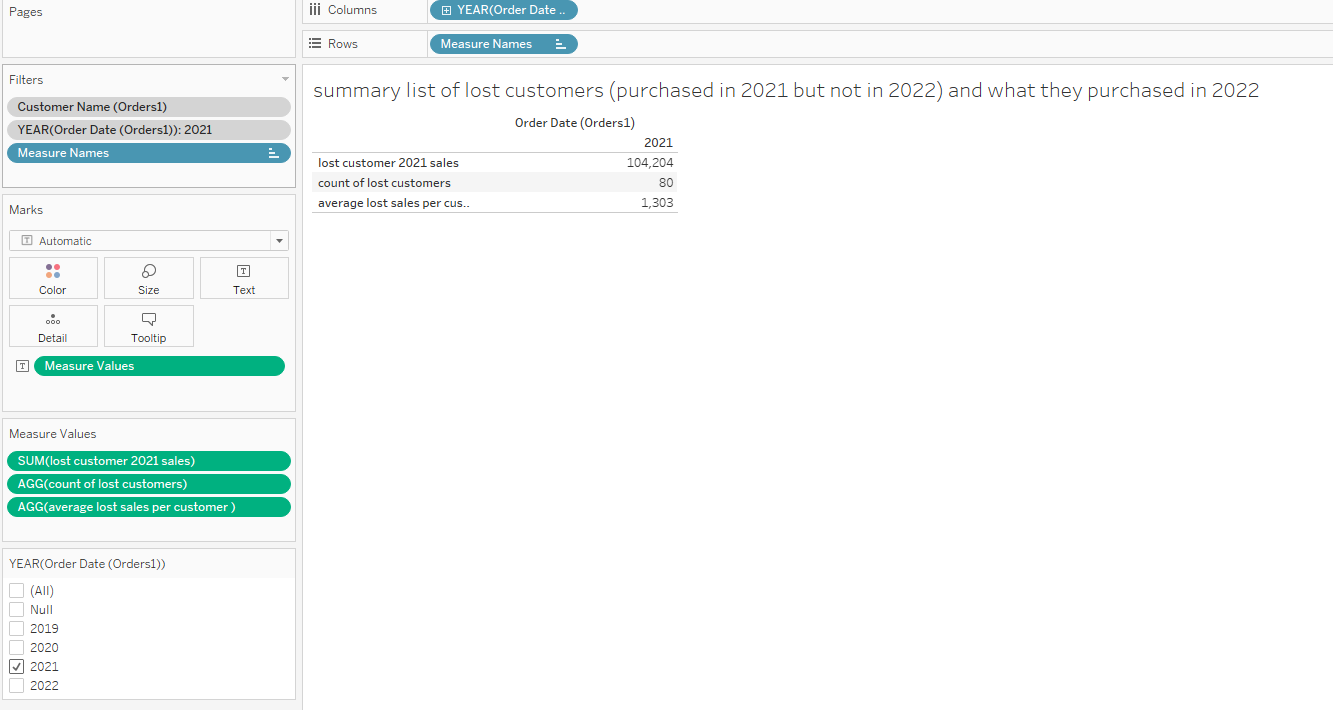
Now it is an easy matter to list the customers lost in 2022 and calculate their impact on sales by filtering for 2021
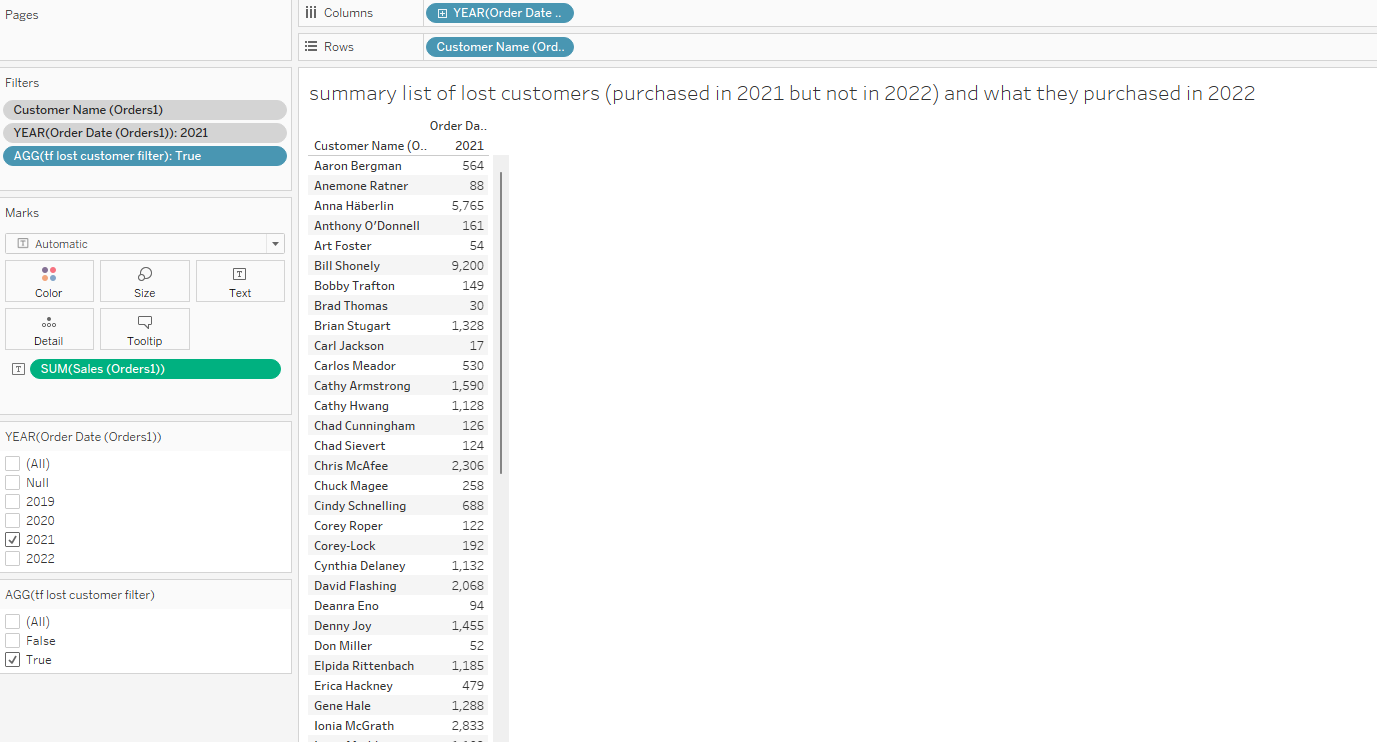
The total lost sales are:
{ FIXED [Customer Name (Orders1)] ,year([Order Date (Orders1)]):(if [tf lost customer filter] then sum([Sales (Orders1)]) end)}
The count of customers is
countd({ FIXED [Customer Name (Orders1)]:(if [tf lost customer filter] then min([Customer Name (Orders1)]) end)})
the average lost sales formula is:
sum([lost customer 2021 sales])/([count of lost customers])
5 Overlapping Groups
We often see questions where users need to overlap groups. This example looks at grouping people into age groups but some names are included in more than one group. The data looks like this
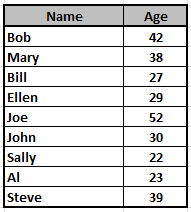
and the user needs to create groups where less the 25 and over 35 overlap the other cohorts.
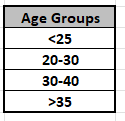
The groupings require using the same record more than once and the solution is to union a copy of the data to itself
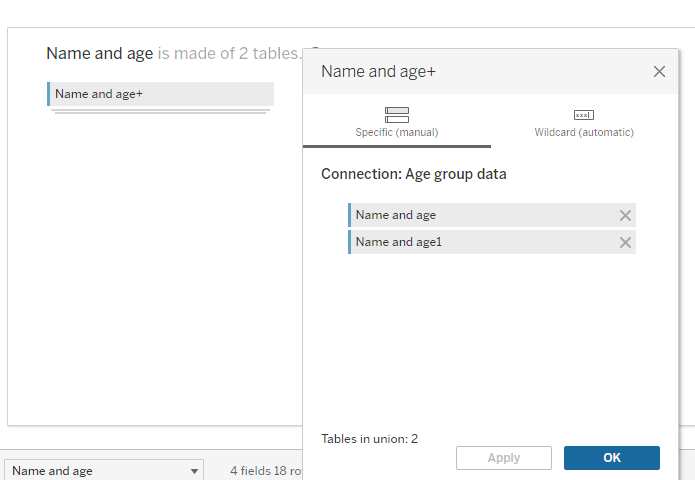
The union appends a copy of the data and adds 2 columns in the data – Table Names and Sheet Name – The Table Name can be used to separate the original data from the copy and is used here to create the overlapping groups
{ FIXED [Table Name],[Name]: Min( if [Table Name]= "Name and age1" and [Age]<25 then "<25"
ELSEIF [Table Name]= "Name and age1" and [Age]>35 then ">35"
ELSEIF [Table Name]= "Name and age" and [Age]>20 and [Age]<=30 then "20-30"
ELSEIF [Table Name]= "Name and age" and [Age]>30 and [Age]<40 then "30-40" end )}
The formula looks more complex than it is – it just uses a copy of the data to form the overlapped groups and the original for the sequential cohorts
they return this when plotted as a bar chart
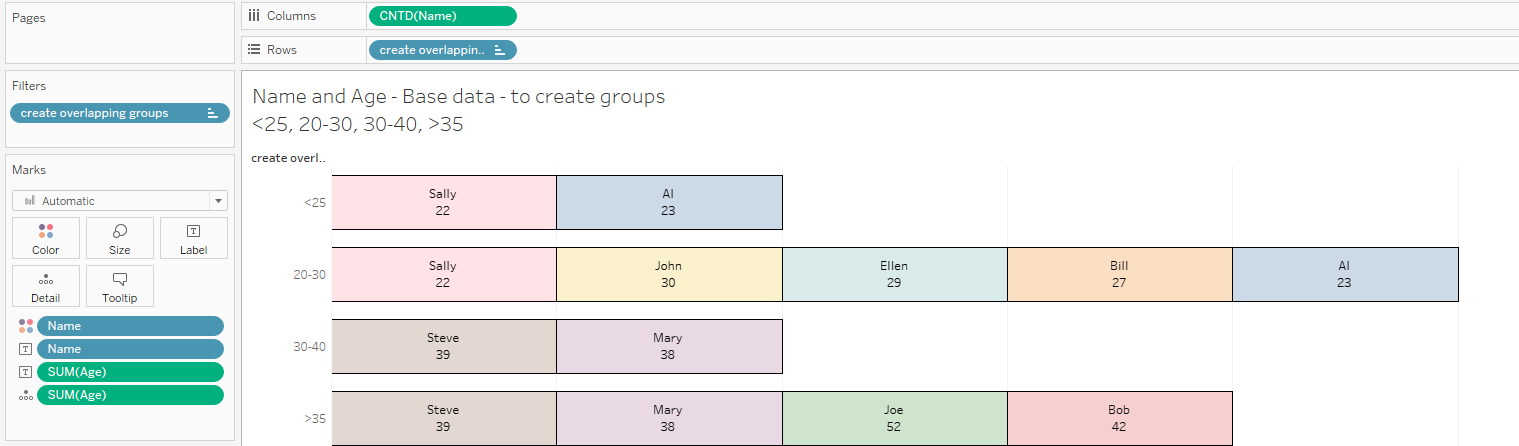
Sally and Al are in the first 2 bars and Steve and Mary are in the last 2 – all others only appear once in the chart
Today we looked at 5 different business use cases where each requires joining or scaffolding to restructure the data set to find a solution. I hope this helps when you face similar questions in your business.
The workbook used here with all the calculations can be downloaded at Link to Workbook
Enjoy
Jim
