
Want to total across the row or column, rank a dimension, or pick out a single value? Then you need a Table Calculation! But how?
See the recording – Link to TC Video

Table Calculation Basics
Table calculations should feel familiar. They operate on the table you see in the view much like those from spreadsheet calculators.
The actual "data table" is a subset of the total data uploaded into Tableau and is created as you place dimensions on the rows or column shelf and apply filters. While the data table, in reality, is tall and narrow you can think of the table calculation operating across the columns or down the rows of the table you see in the viz.

With a spreadsheet calculator, you write a formula in a cell and then copy it across the rows or down the column to the remaining cells, Table calculations create a dimension or a measure that does that for you but you need to tell Tableau in which direction the formula is applied.
Table calculations are applied either ACROSS the columns or DOWN the rows:
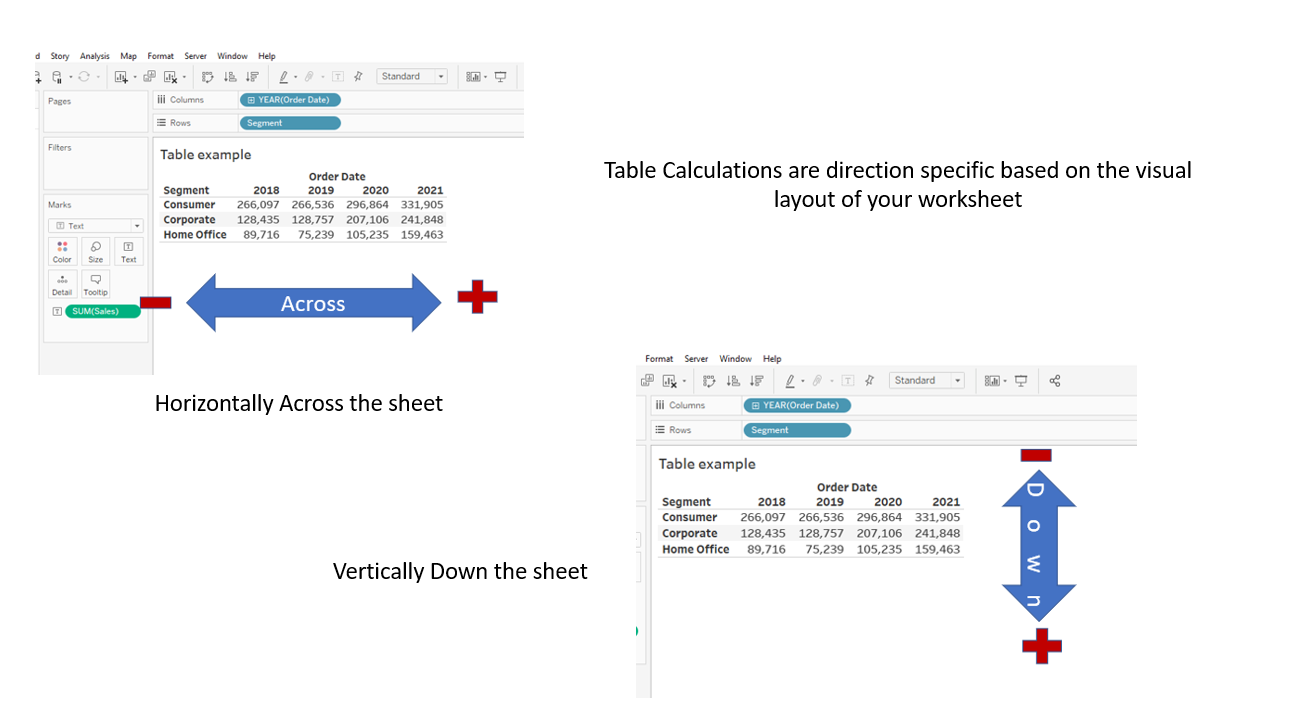
Addressing is significant, across increments positively to the right, and negative to the left. Down is positive down and negative up.
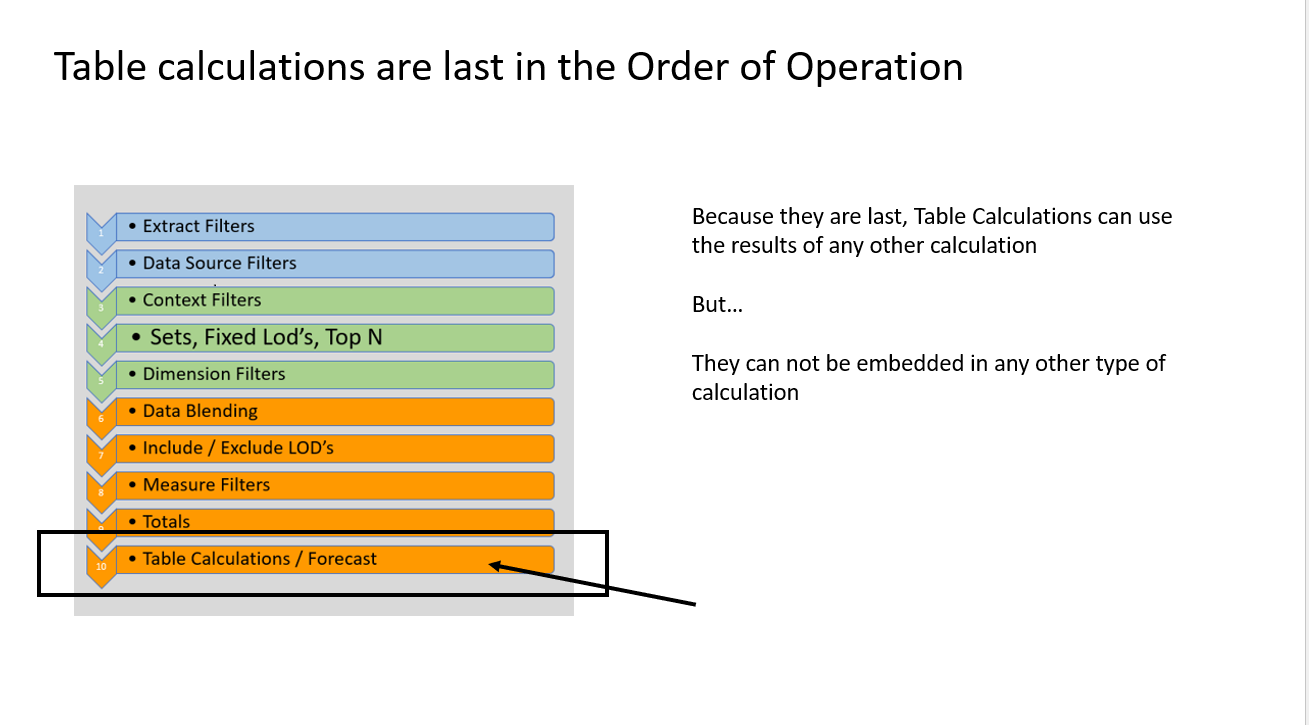
Order of Operation effect
Table calculations are last in the order of operation. All other types of calculations are complete, and context or dimension filters have been applied.
Consequently, the results of table calculations can not be used in LOD expressions, and some Grand Totals or Sub Totals can be affected. On the other hand, the results from LODs can be used in table calculations and they can be nested within themselves.
Syntax
The syntax for table calculations is:
Window_sum(Sum(measure),Start,Finish)
A keyword (Window_sum here) tells Tableau which aggregation function to use to calculate the overall total. The first argument in the parentheses is the measure to use and it is always aggregated.
In this example, sum() tells Tableau to sum the individual records from the detail data table and use those totals in the overall aggregation. Start and finish are where to begin and end the overall aggregation – more on that later

How do Table Calculations work?
1 – Simple window calculations
We'll start with a couple of simple window calculations based on this data set:

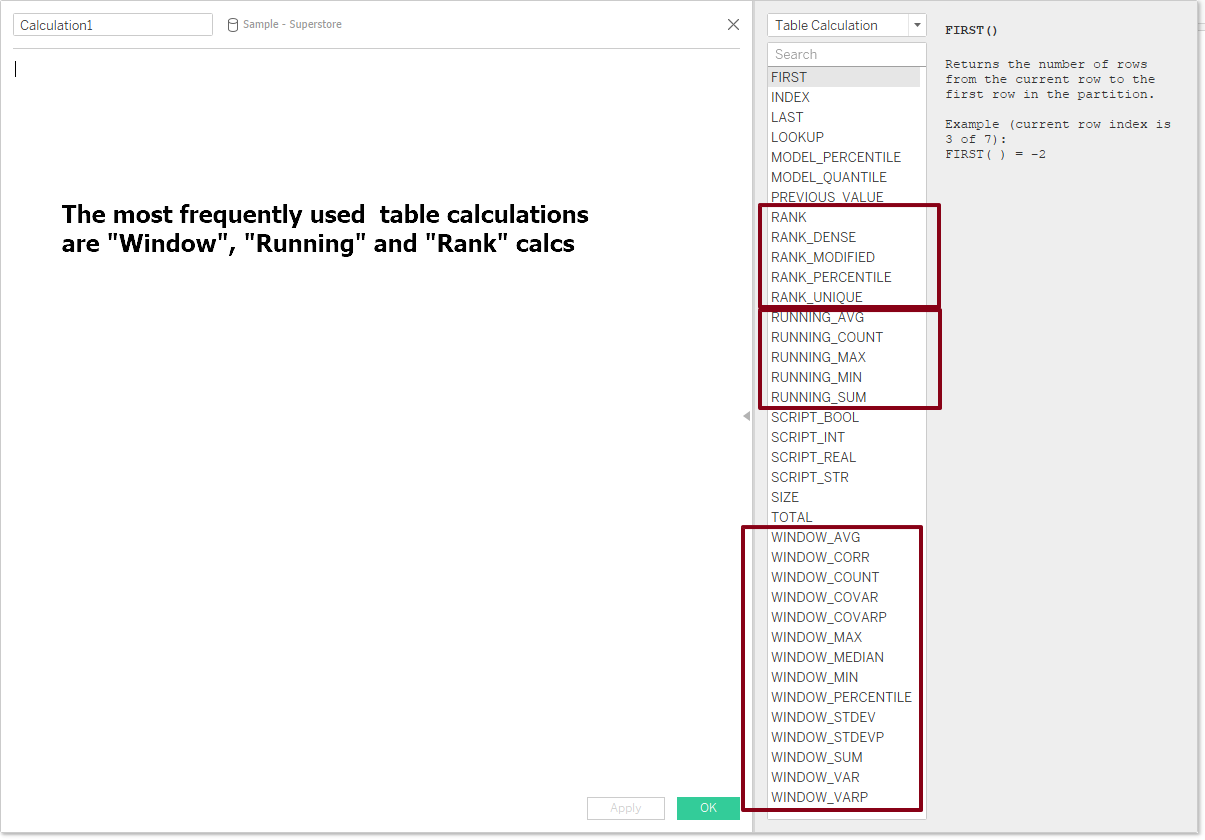
The most frequently used types of calculations are the "Window", "Running" and "Rank" calculations found under "Table Calculations" in the wizard.
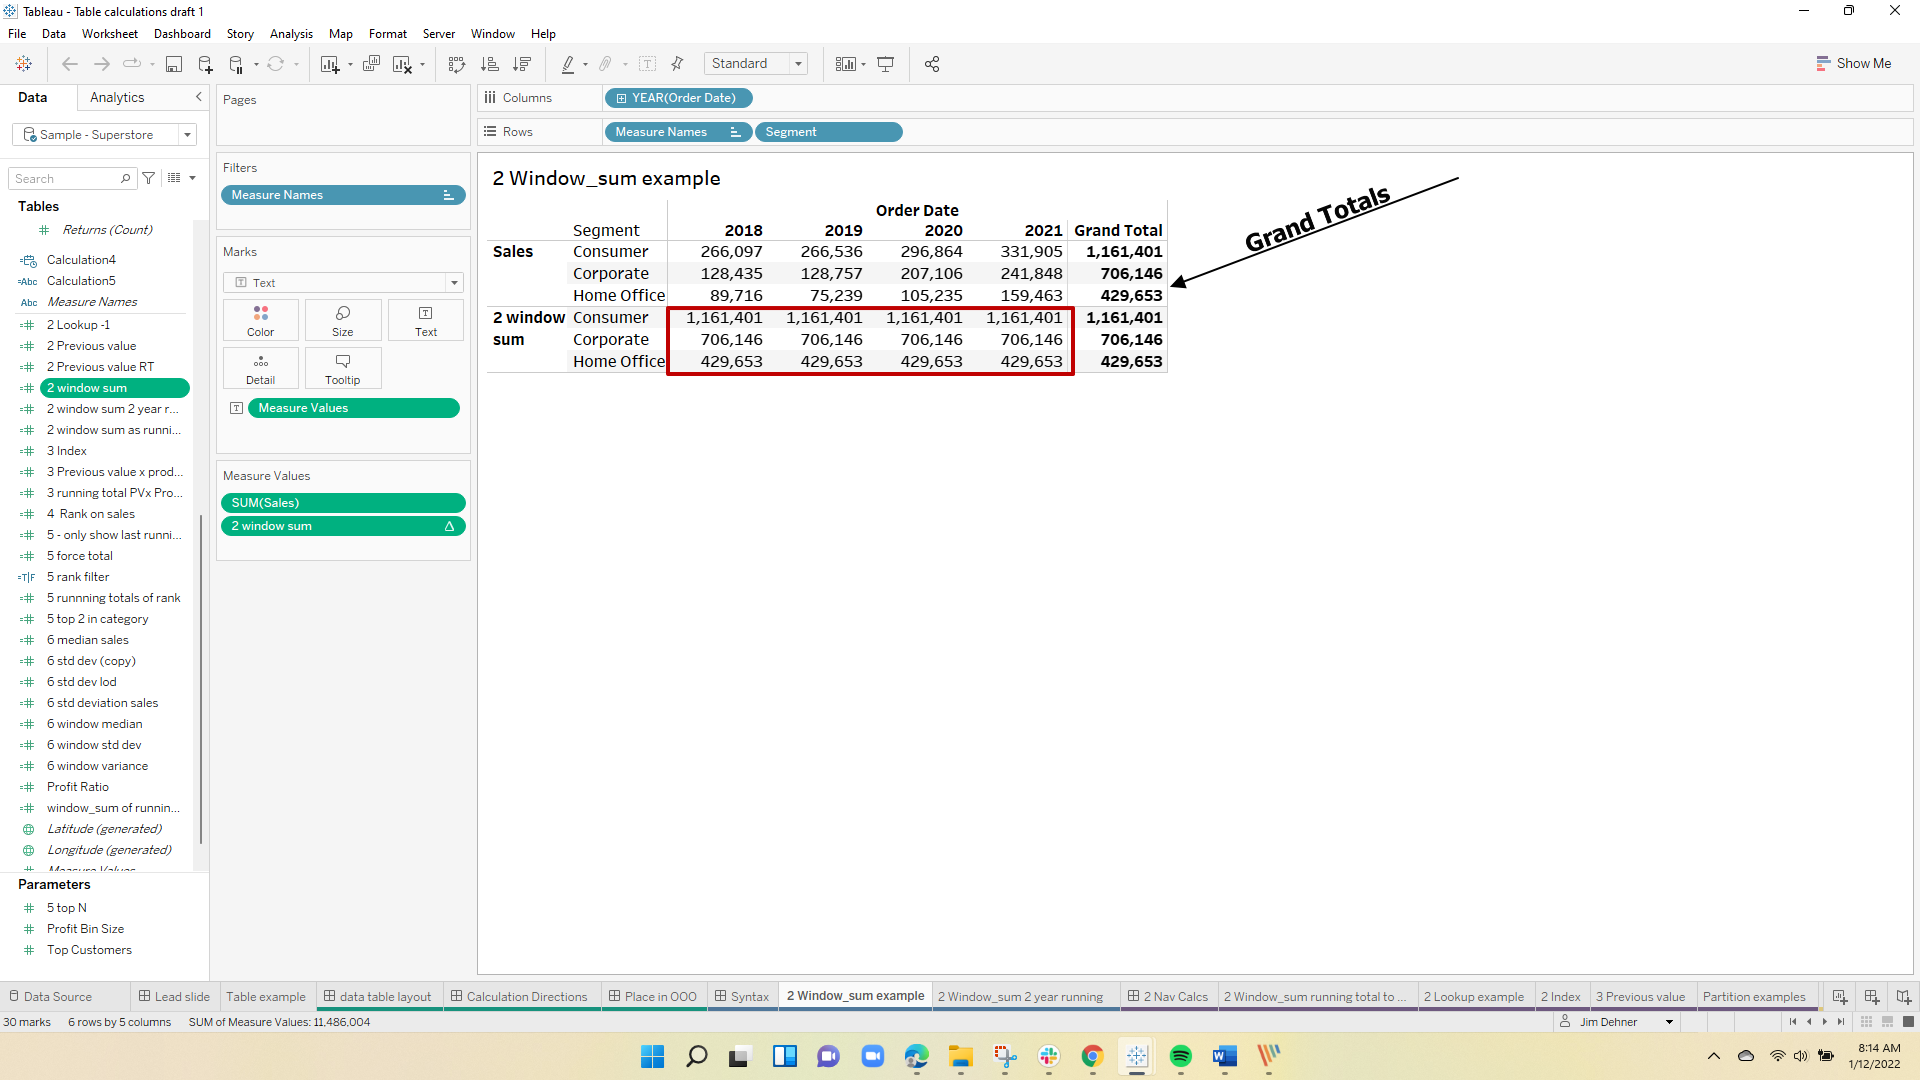
Starting with Windows the formula for getting the total across the table would be
Window_sum(sum([Sales]),FIRST(),LAST())
Which in words says – take the sum of [Sales] for each year/segment combination and total them from the first cell through the last – the calculation order is Across – (note if first and last are omitted they are assumed to be from the first cell through the last). The value in each cell is the total for the "Row"
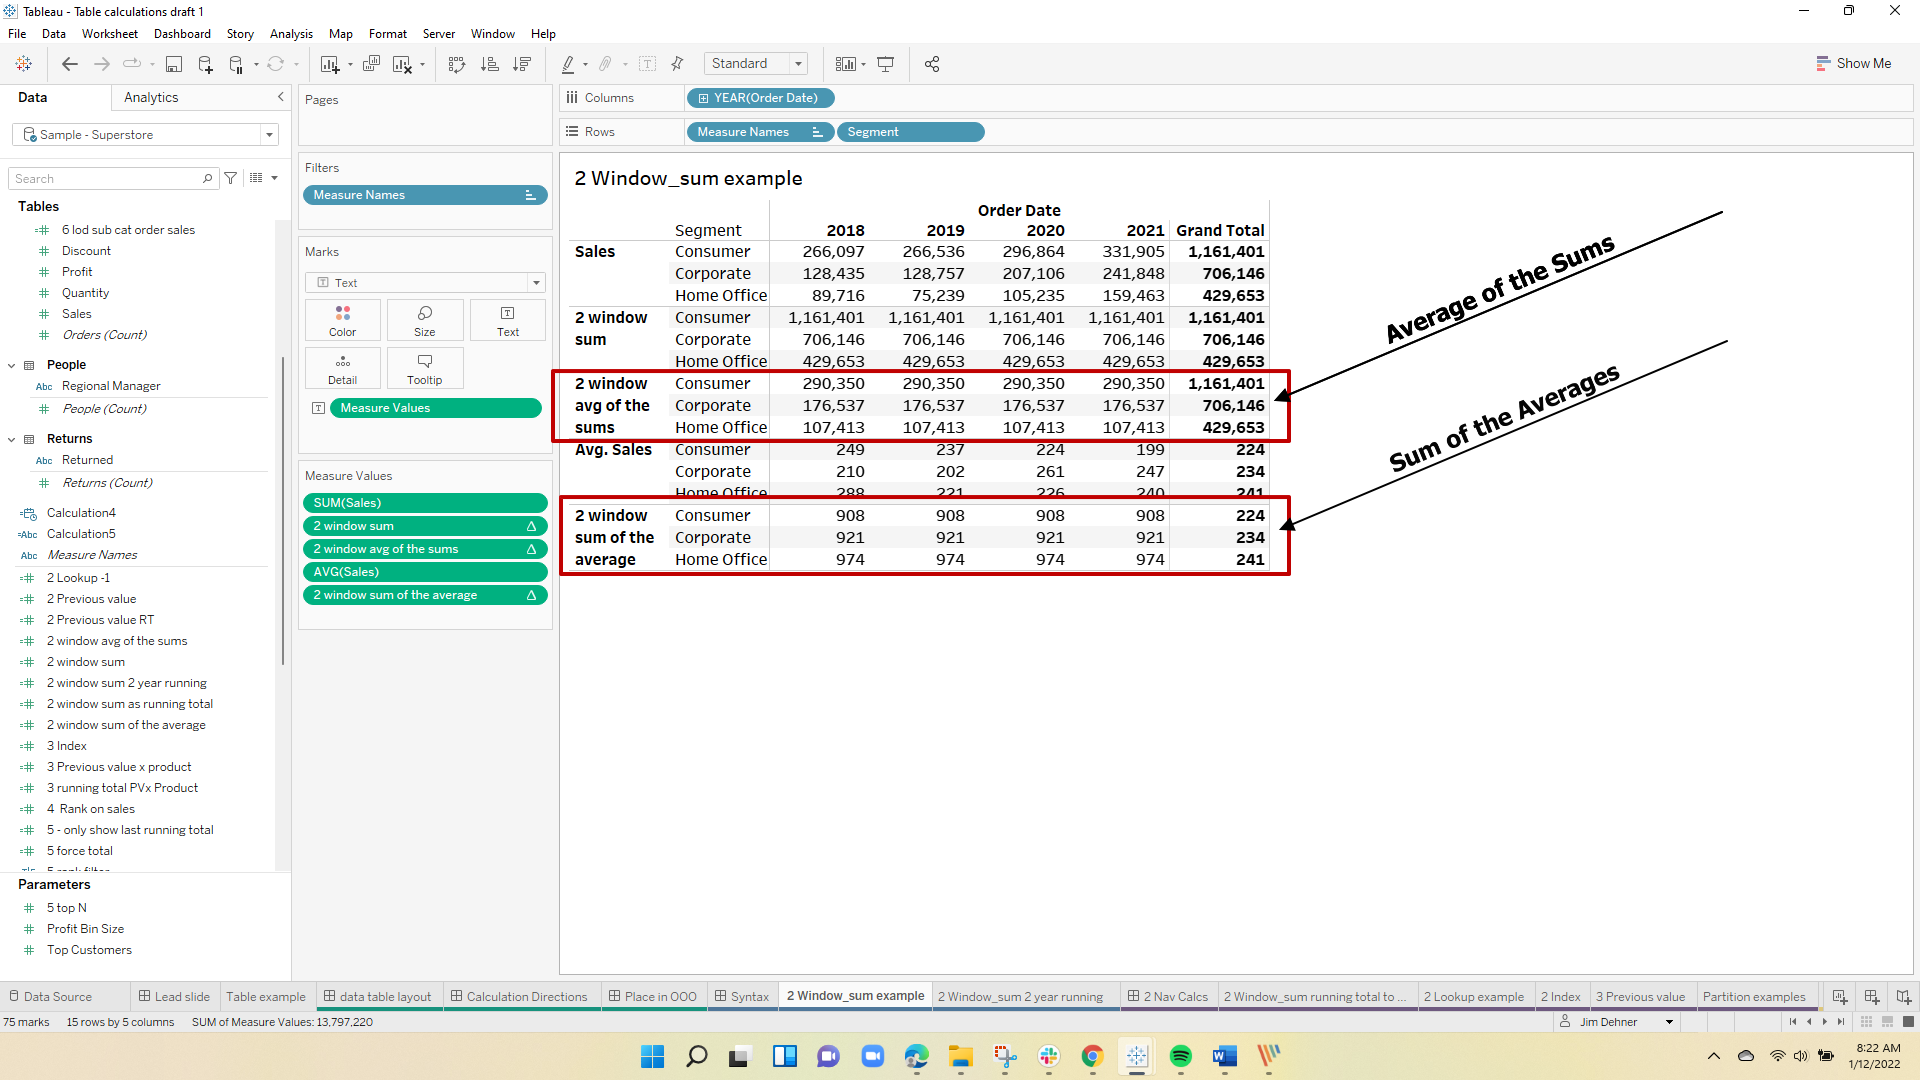
To illustrate the differences between the inner aggregation and the window aggregation level, we could also have calculated the sum of the average values as
window_sum(avg([Sales]),FIRST(),LAST())
and the average of the sum as
window_avg(sum([Sales]),FIRST(),LAST())
and they return this:
One more option, before we move on.
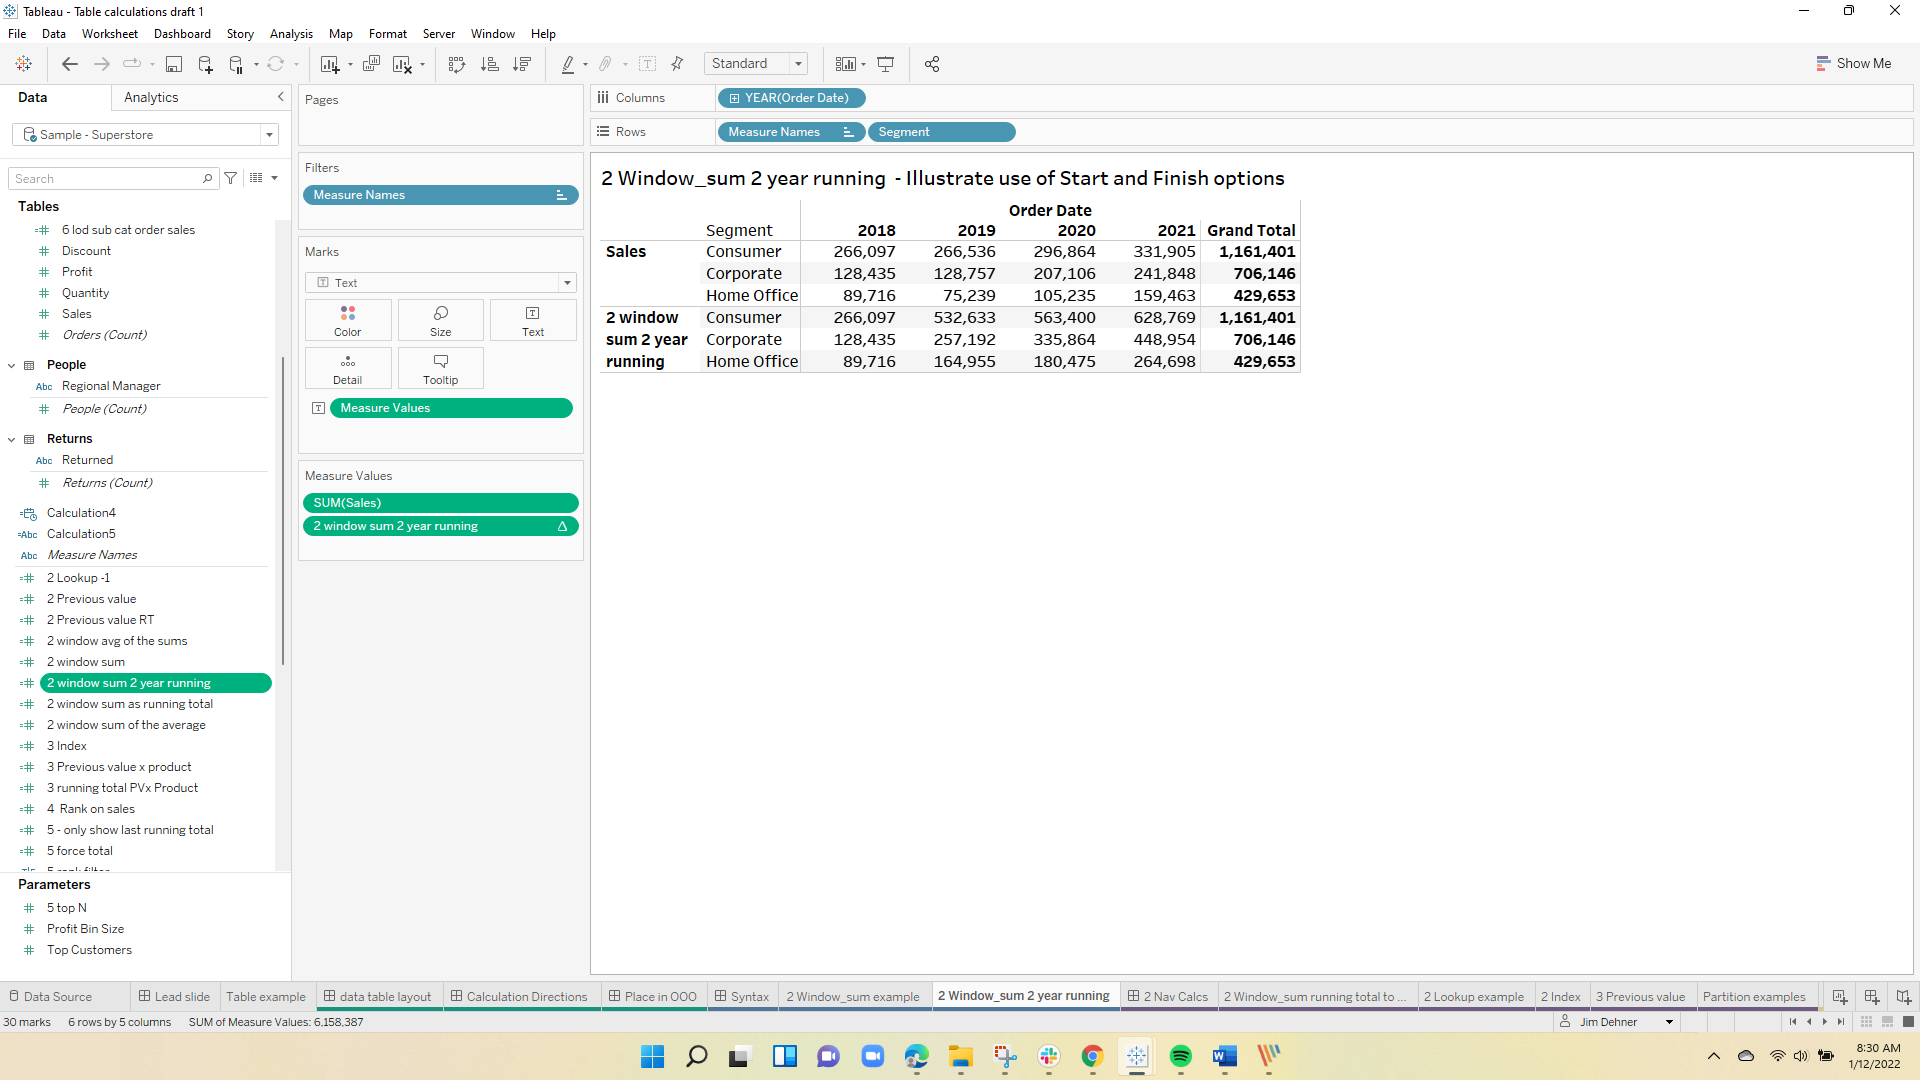
What happens when we add a start and end value? This formula will return the 2-year total – in words, it says to start totaling 1 cell back (-1 or to the left) and ends with the current cell (0) and sums the values together
window_sum(sum([Sales]),-1,0)
It returns this:
Five table calculations are used to navigate around the table – similar to "Offset" in Excel
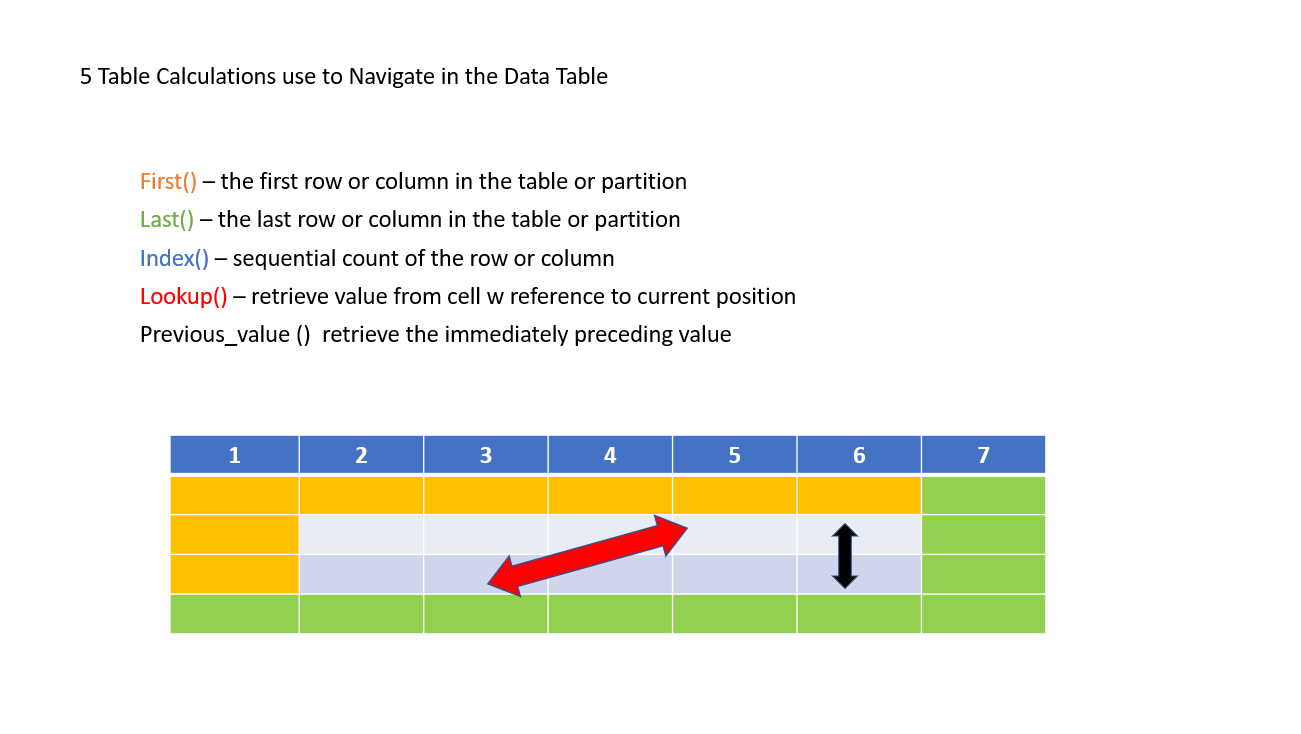
Using the function will take you to the location with respect to the current cell and return the value found in that cell.
First(), or Last() refer to the first row or column in the table or the last row or column. Index just increments (counts) across the row or column – +1 is one to the right or down, +2 is 2 cells right or down, etc.
Lookup() goes to a specific cell – +5 goes to the 5 cells in a positive direction and returns the value found there
Previous_value() looks to the immediate preceding cell.
It is important to note that navigation is based on the location in the table. New users often get confused believing the value is considered – e.g. in a date field lookup(ATTR(date),-5) is looking back 5 columns in the date field NOT 5 days.
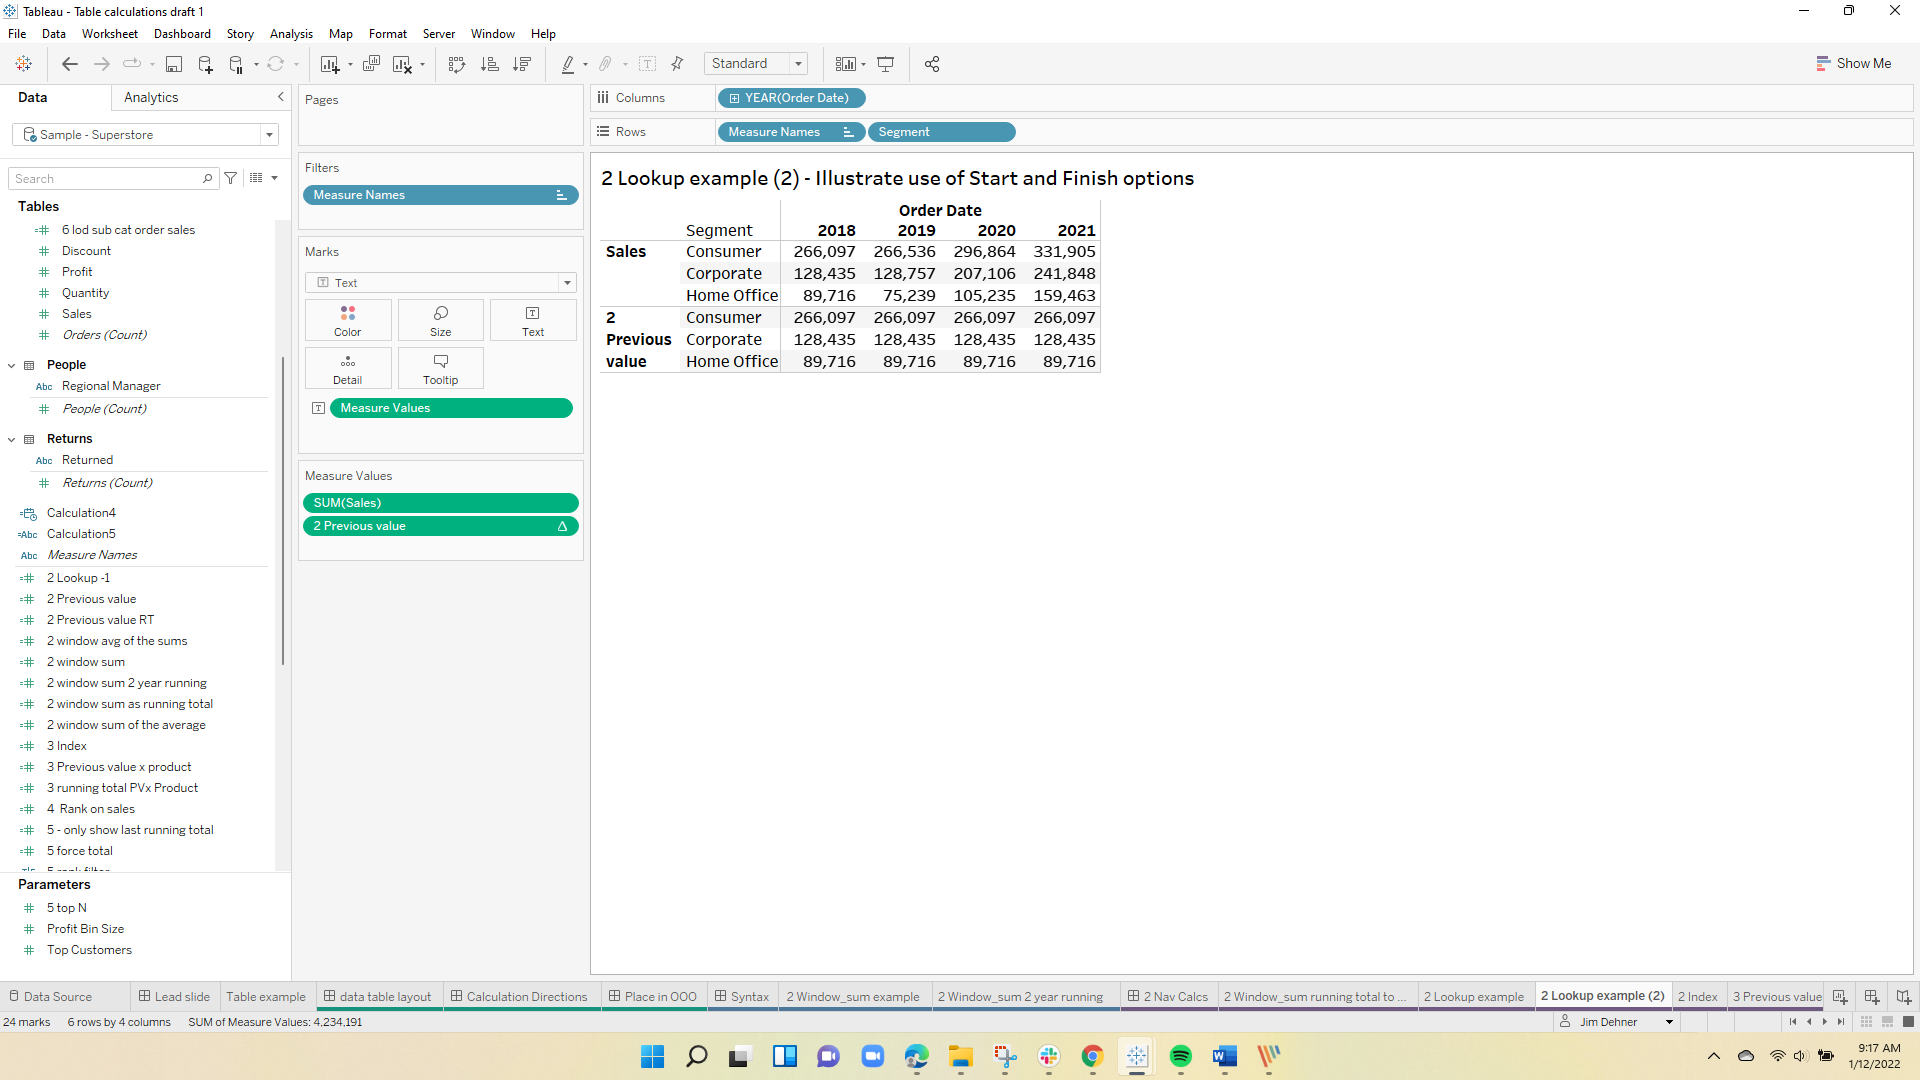
2 – Lookup functions
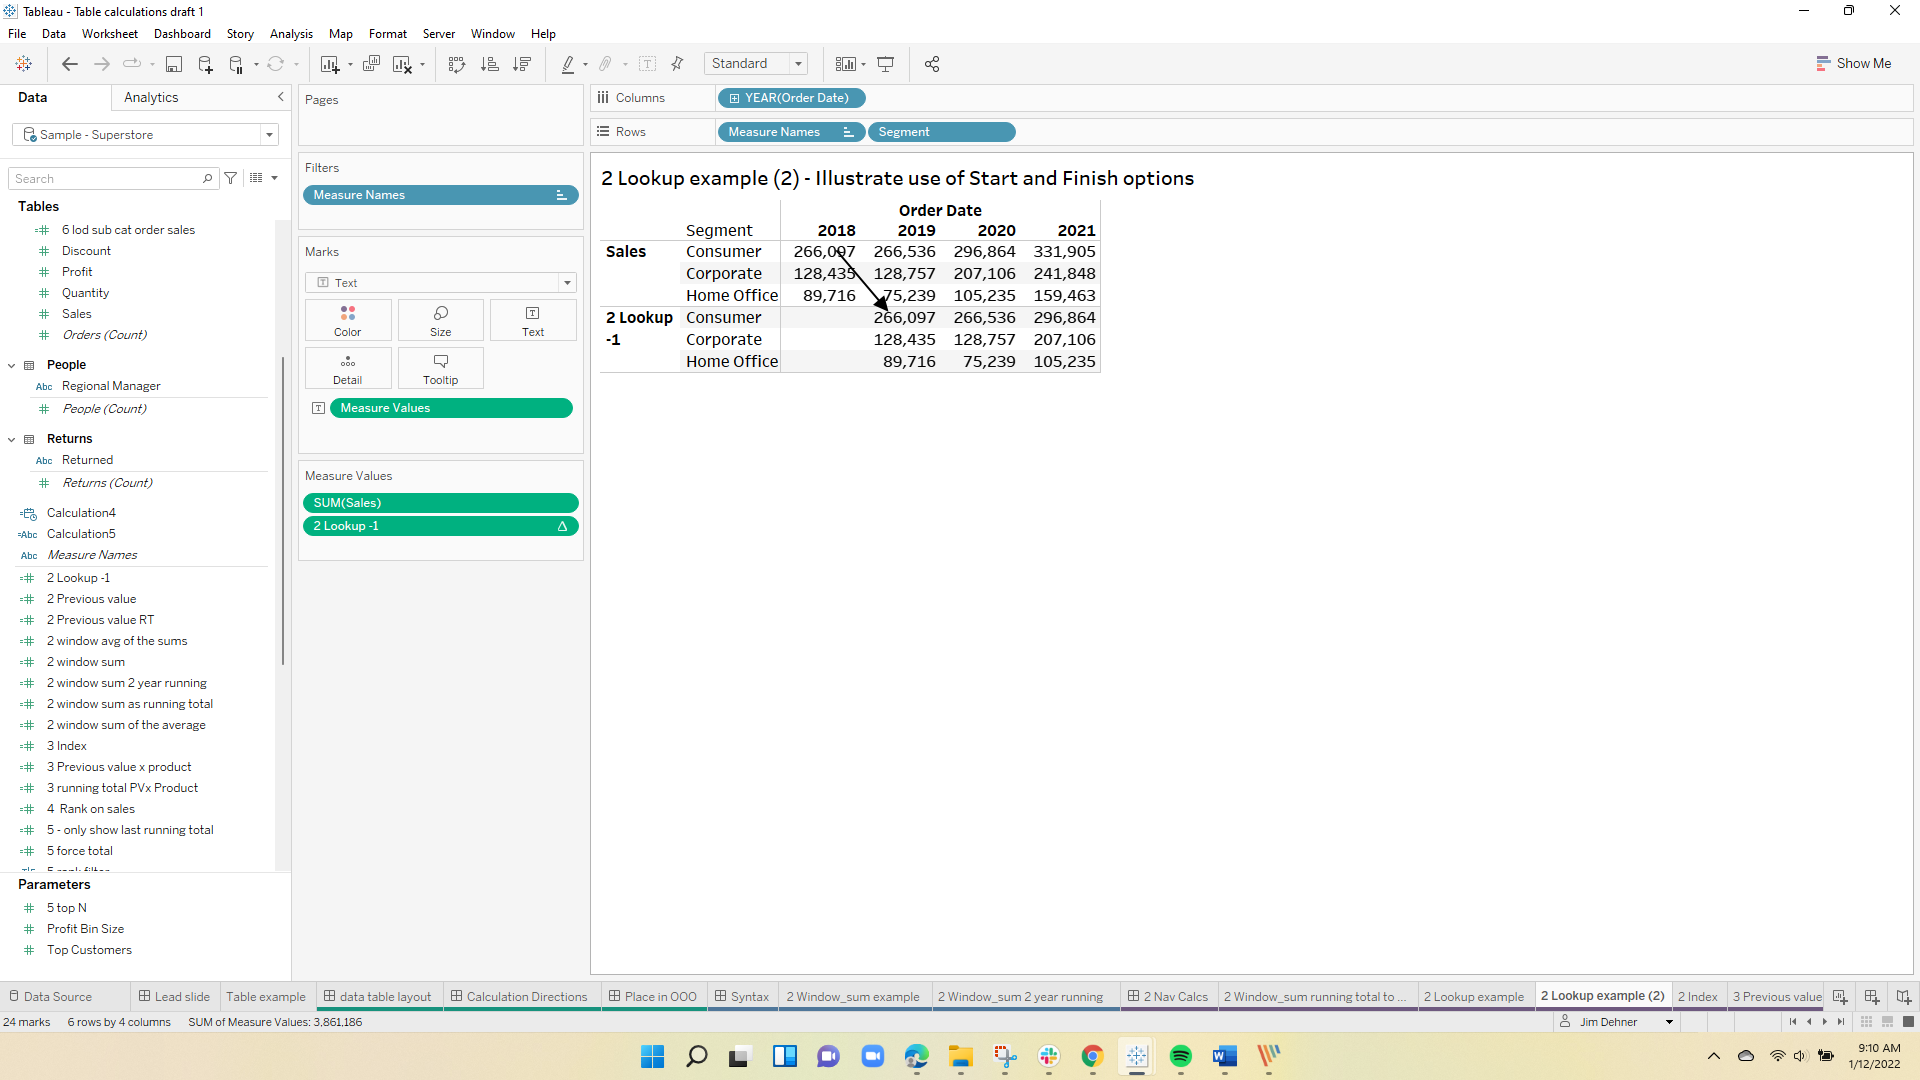
Lookup() will return the value in the cell distance from the current cell location. In words, this formula says to move to the left 1 column and go to the rows marked sum(Sales) and return the value found there.
Lookup(sum([Sales]),-1)
You are retrieving values from the table that is visible in the worksheet and those values are aggregated – so table calculations are also always an aggregation.
In this case, the formula returns this:
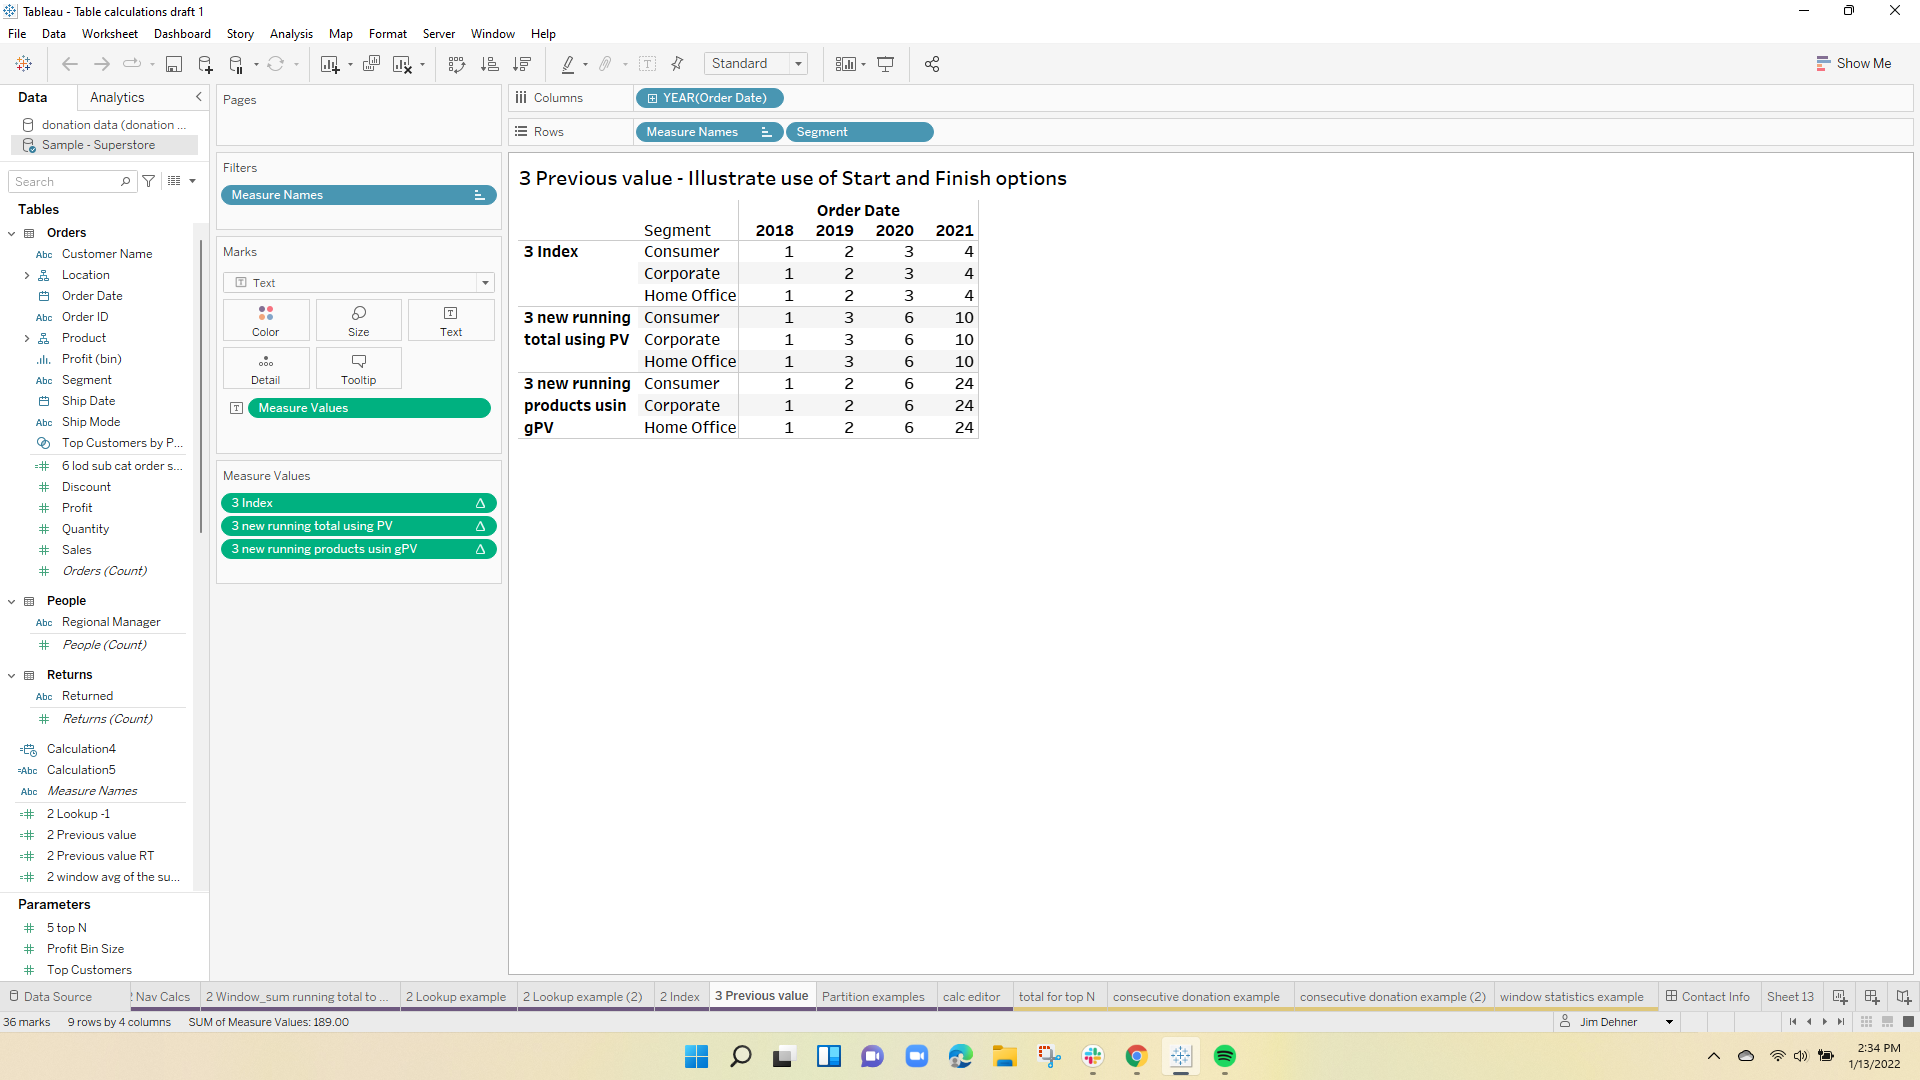
3 Previous Value
Unlike Lookup, Previous Value operates in the same row (or column) as the current cell. This formula:
PREVIOUS_VALUE(sum([Sales]))
Using the same table, the Previous value returns:
Previous value can also be used to calculate the running total or the running product. The formula
sum(value)+previous_value(0)
will return the running total and
sum(value)*previous_value(1)
returns the running product
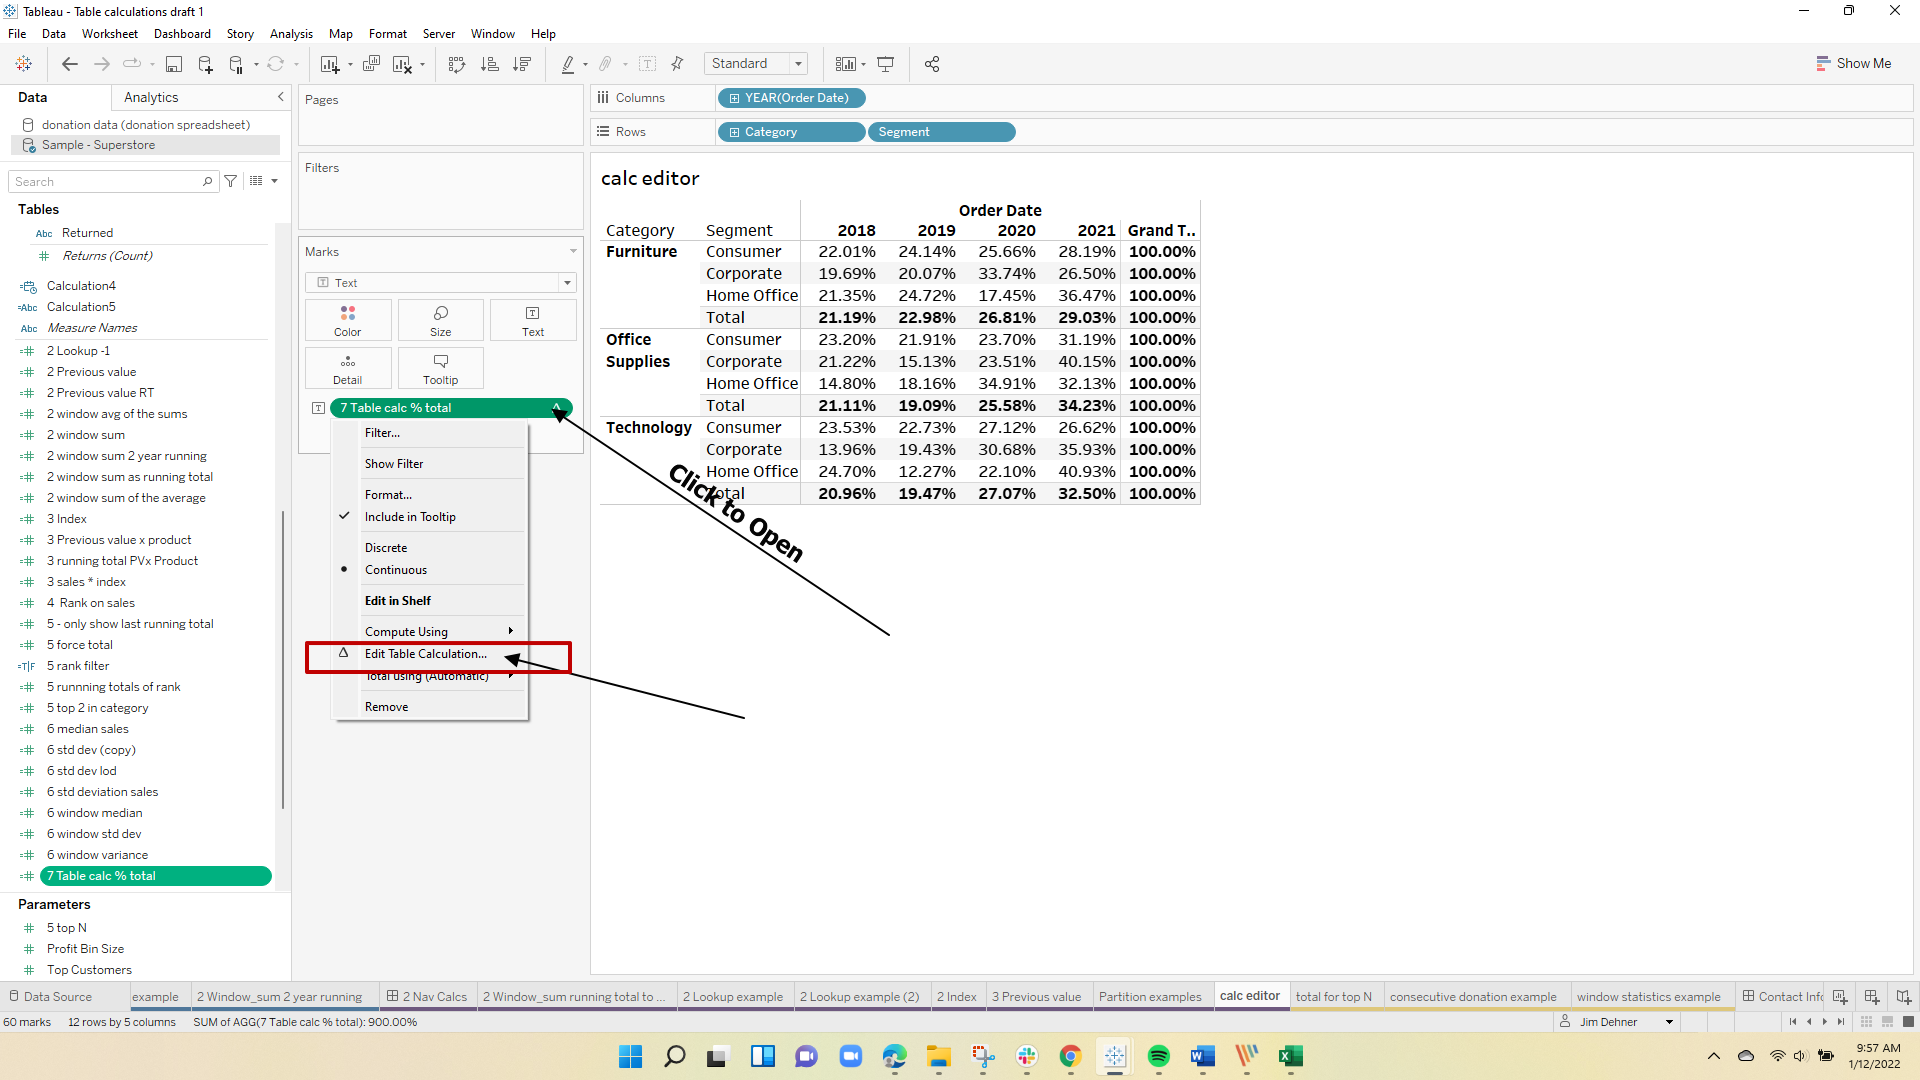
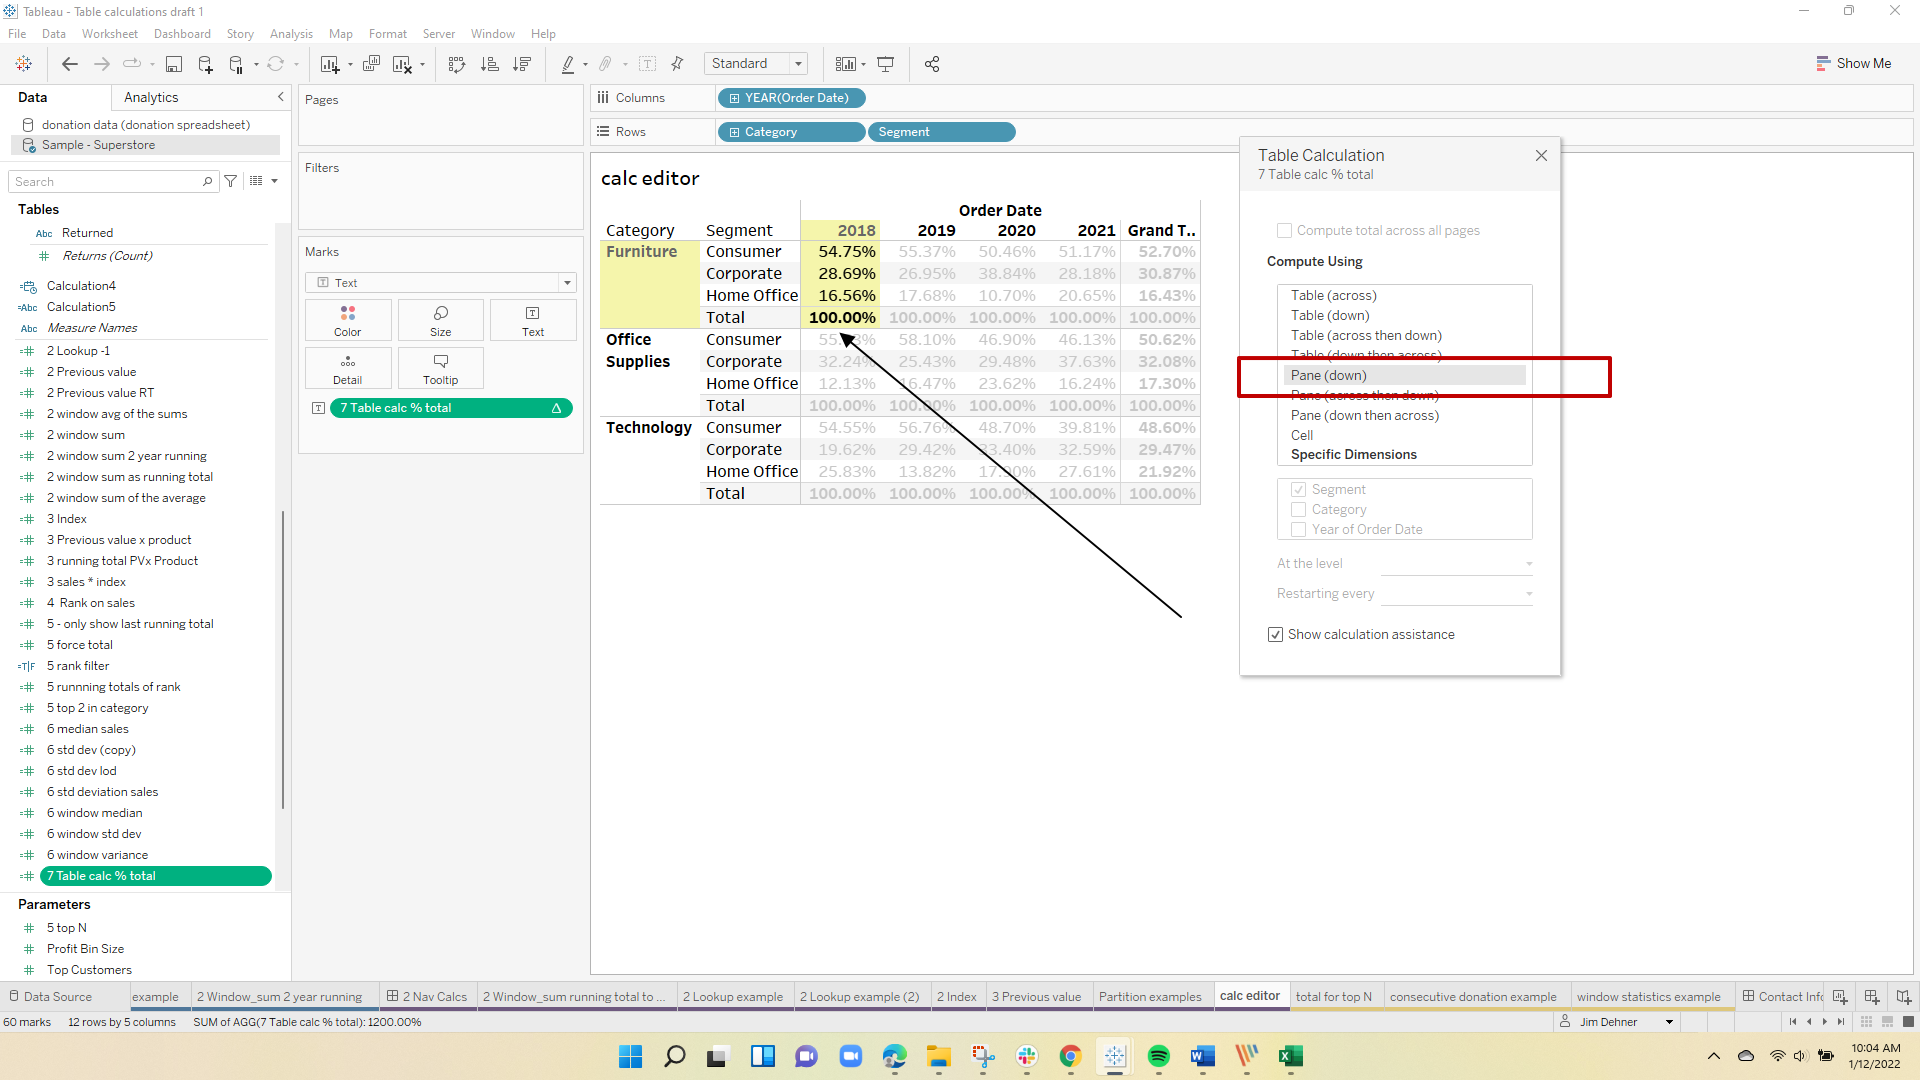
4 Table Calculation Editor
The direction and scope of the table calculation establish if the calculation is determined across the columns or down the rows and how much of the table is included.
For this example, I have added Category to the table to create an additional partition
There is a table calculation to determine the percent of the total. Initially, the calculation is set to Across – so each row totals 100%.
To open the Editor – select Edit Table Calculation
When the Editor opens the Direction and Scope are highlighted
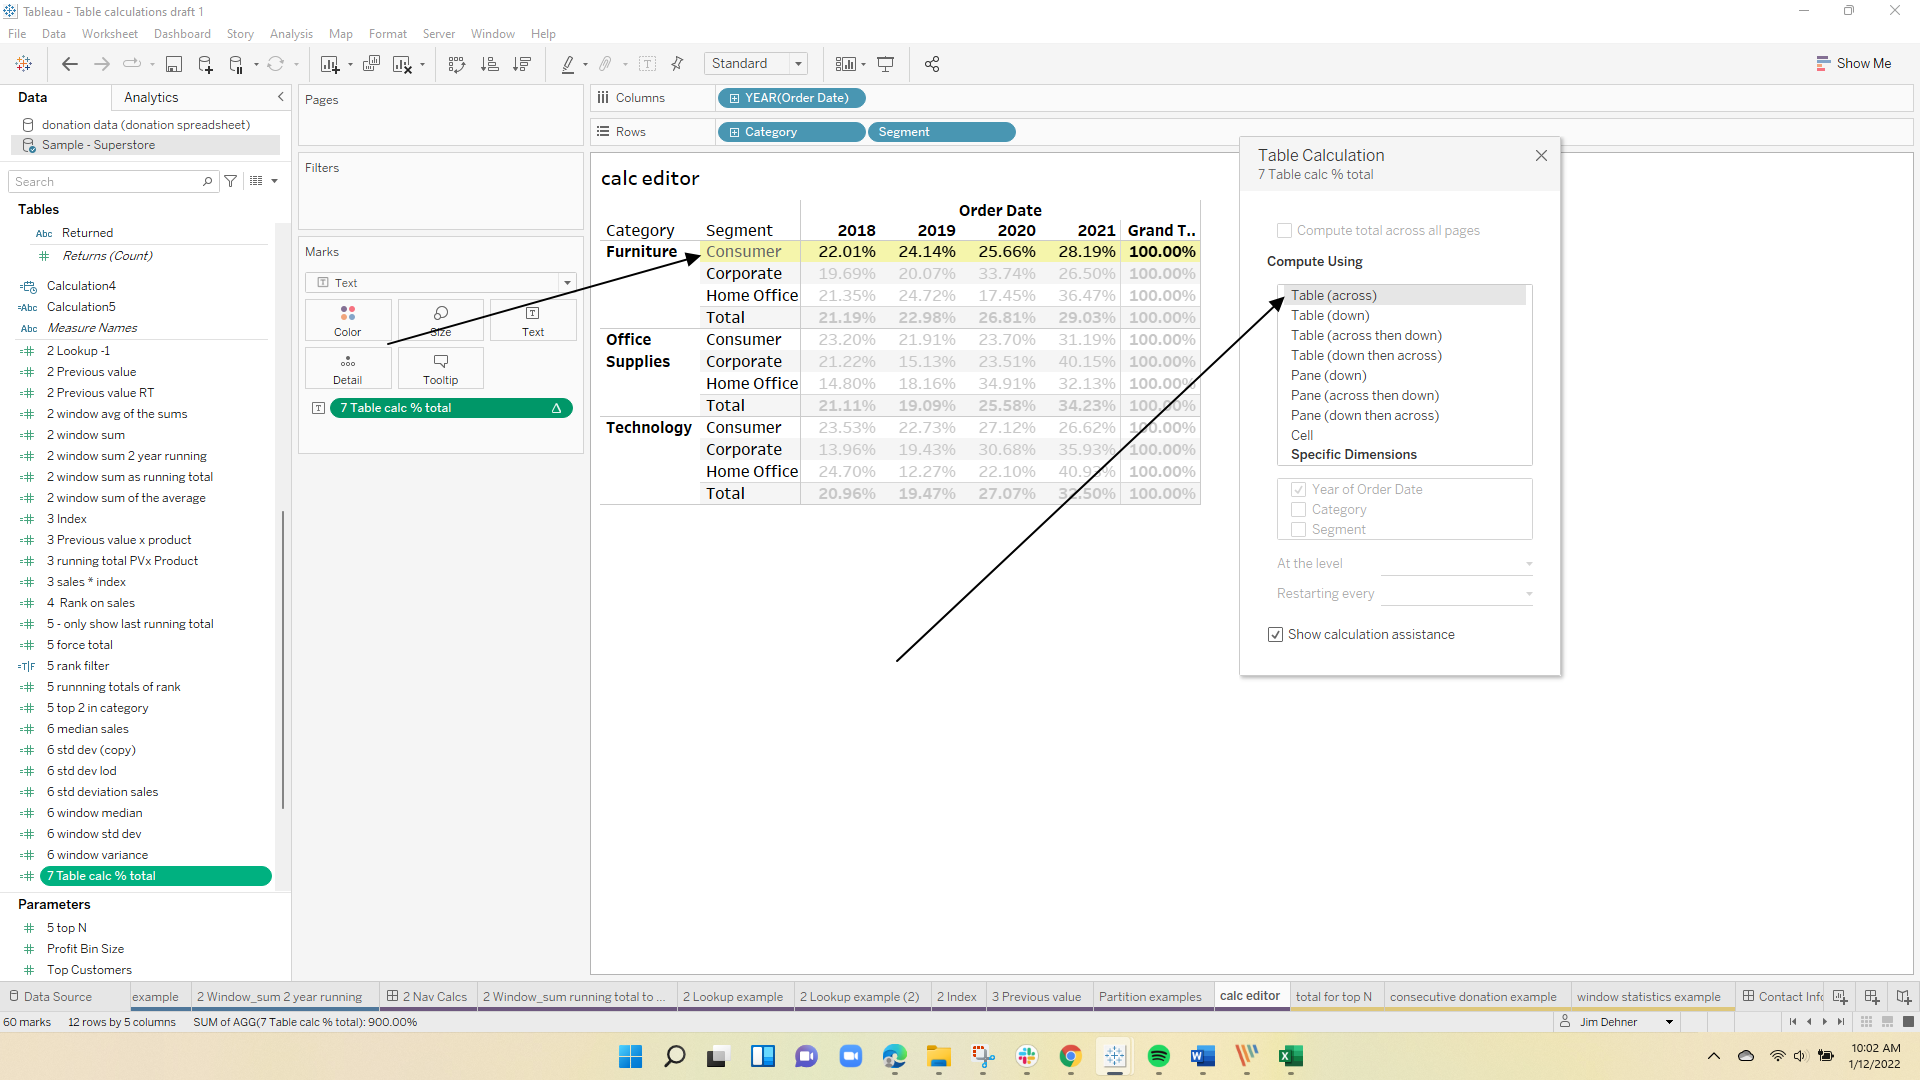
Using the Editor the scope and direction can be changed – the highlighter adjusts to show how the table calculation will be executed
Now you need to practice!!
For the more advanced user see Link to TC Use Cases – it contains several use cases that will test you abilities with Table Calculation
