
Filters are easy to use, but why are they so often a source of confusion? (see the video Link to Filter Video
There a 6 unique types of filters – each has a specific purpose and is applied at different points in the order of operation
- as you load data
- structure the data table
- add values to the table
- or change the viz.
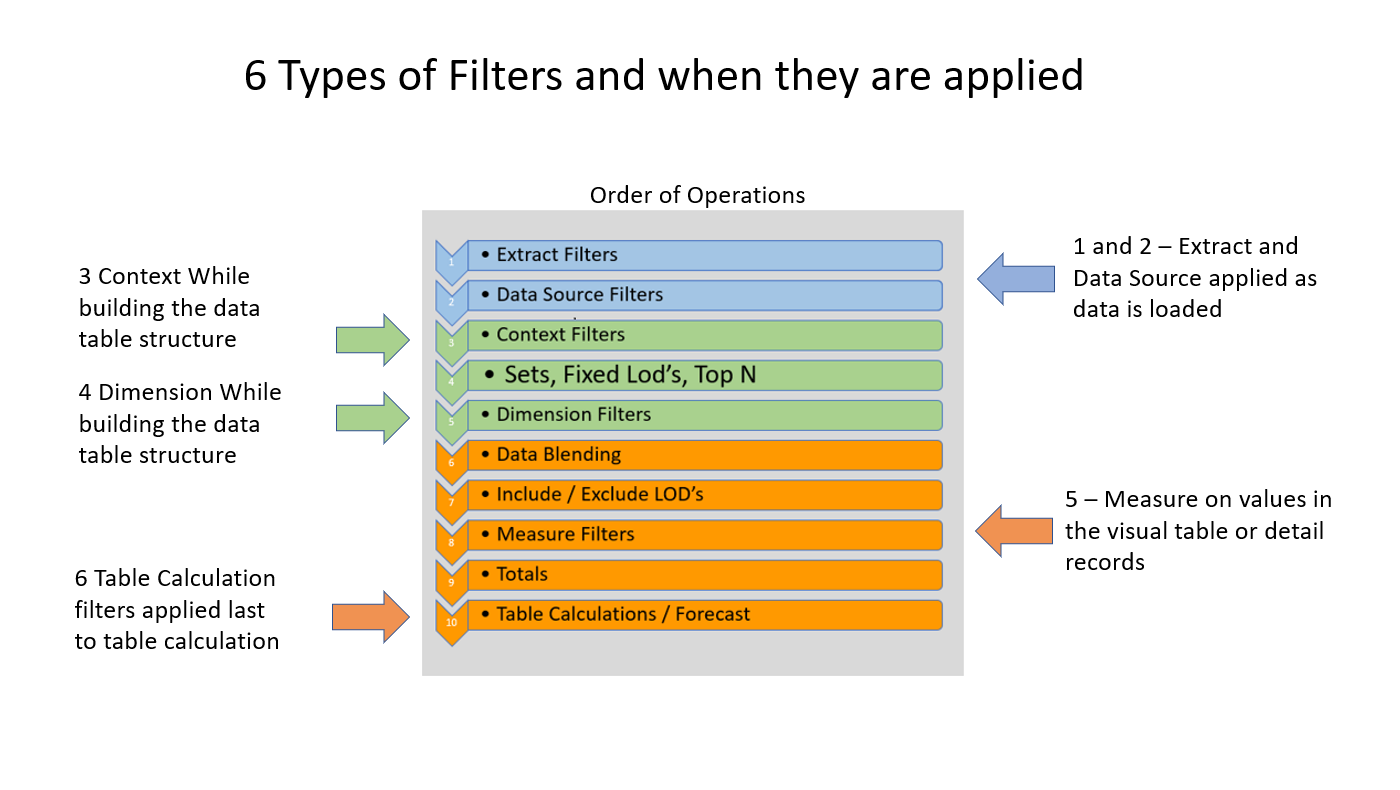
Extract and Data Source Filters
Extract and Data Source filters are "workbook level" filters. They are applied as you load or extract data bringing it into Tableau. Data that is filtered out is not in the workbook. Eliminating unneeded data improves performance and reduces complexity in the workbook.
Extract and Data Source filters are easily configured on the Data Source tab:
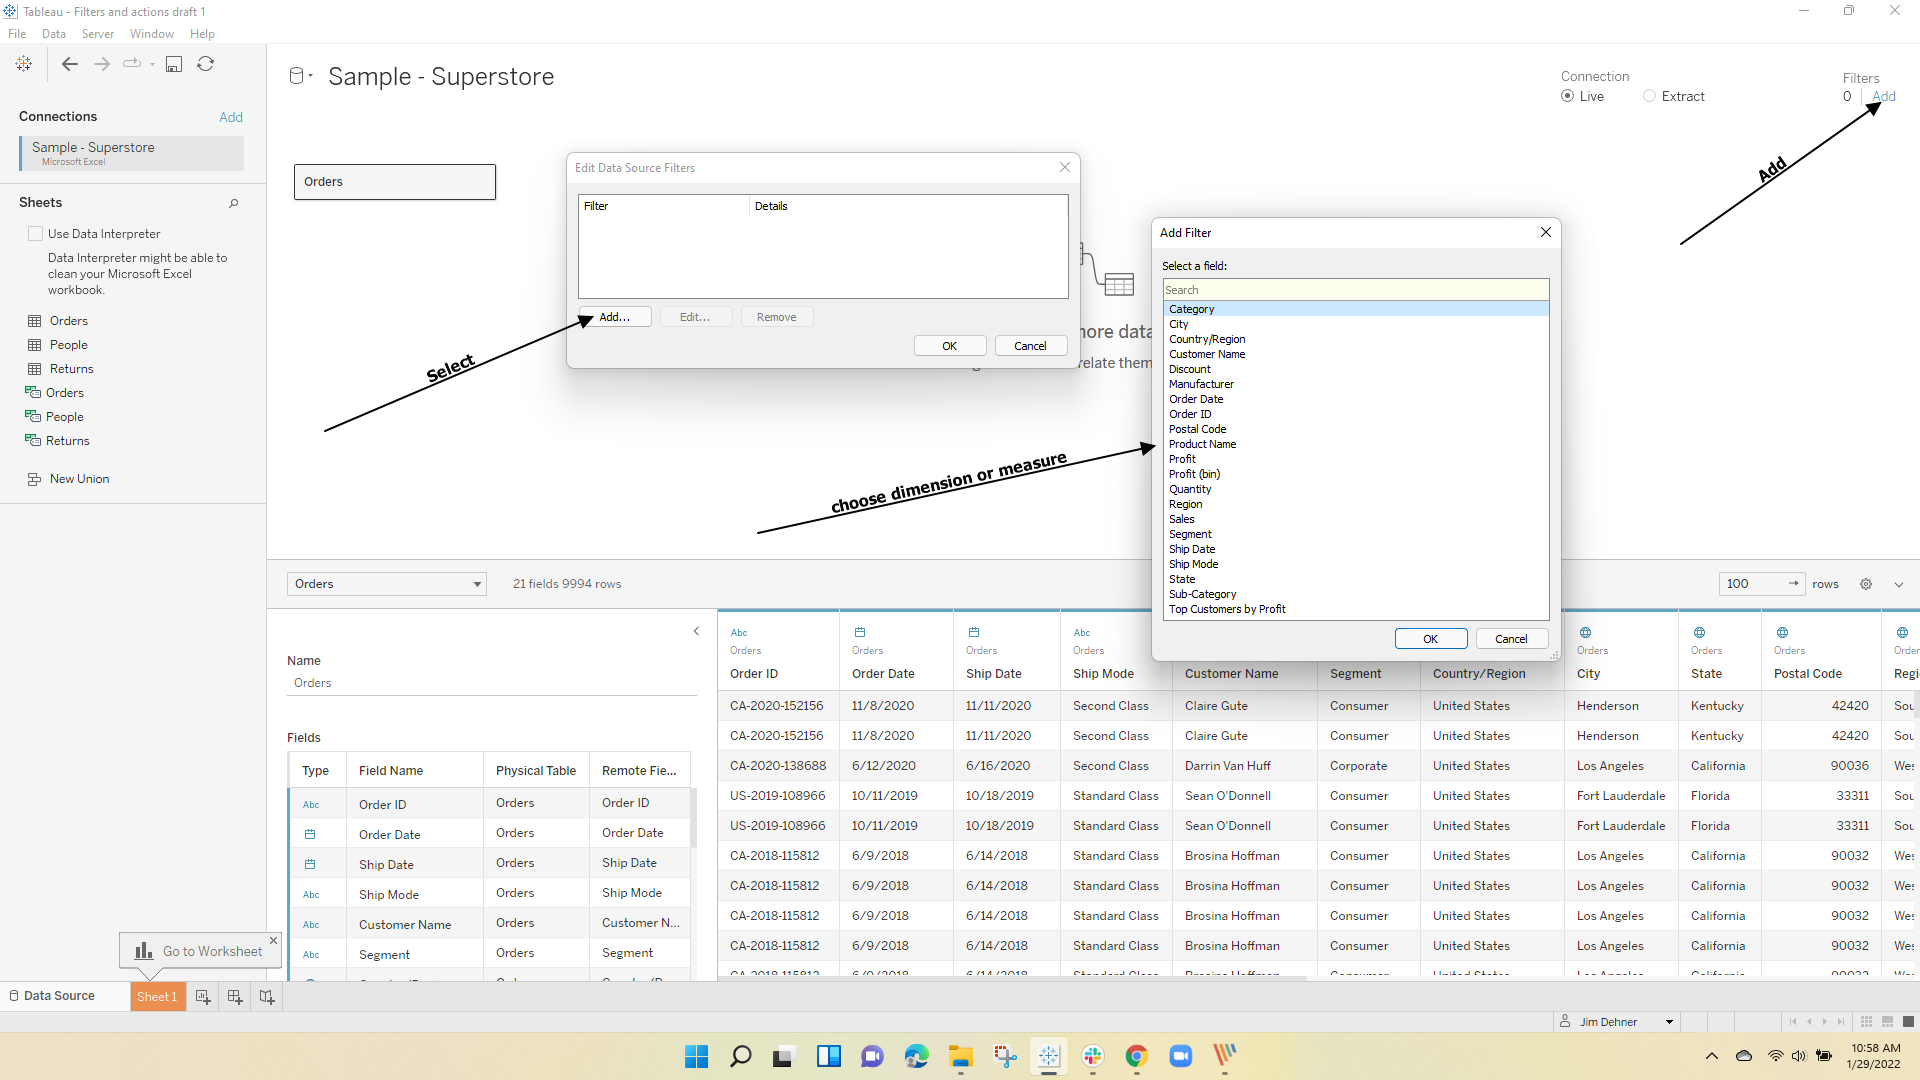
In the upper right corner of the canvas is an ADD button which will open a window where the dimension or measure to be filtered can be selected. A second window opens allowing the user to select the values to be included in the workbook. Filters can be placed on be discrete dimensions:

or continuous measures at the record level:

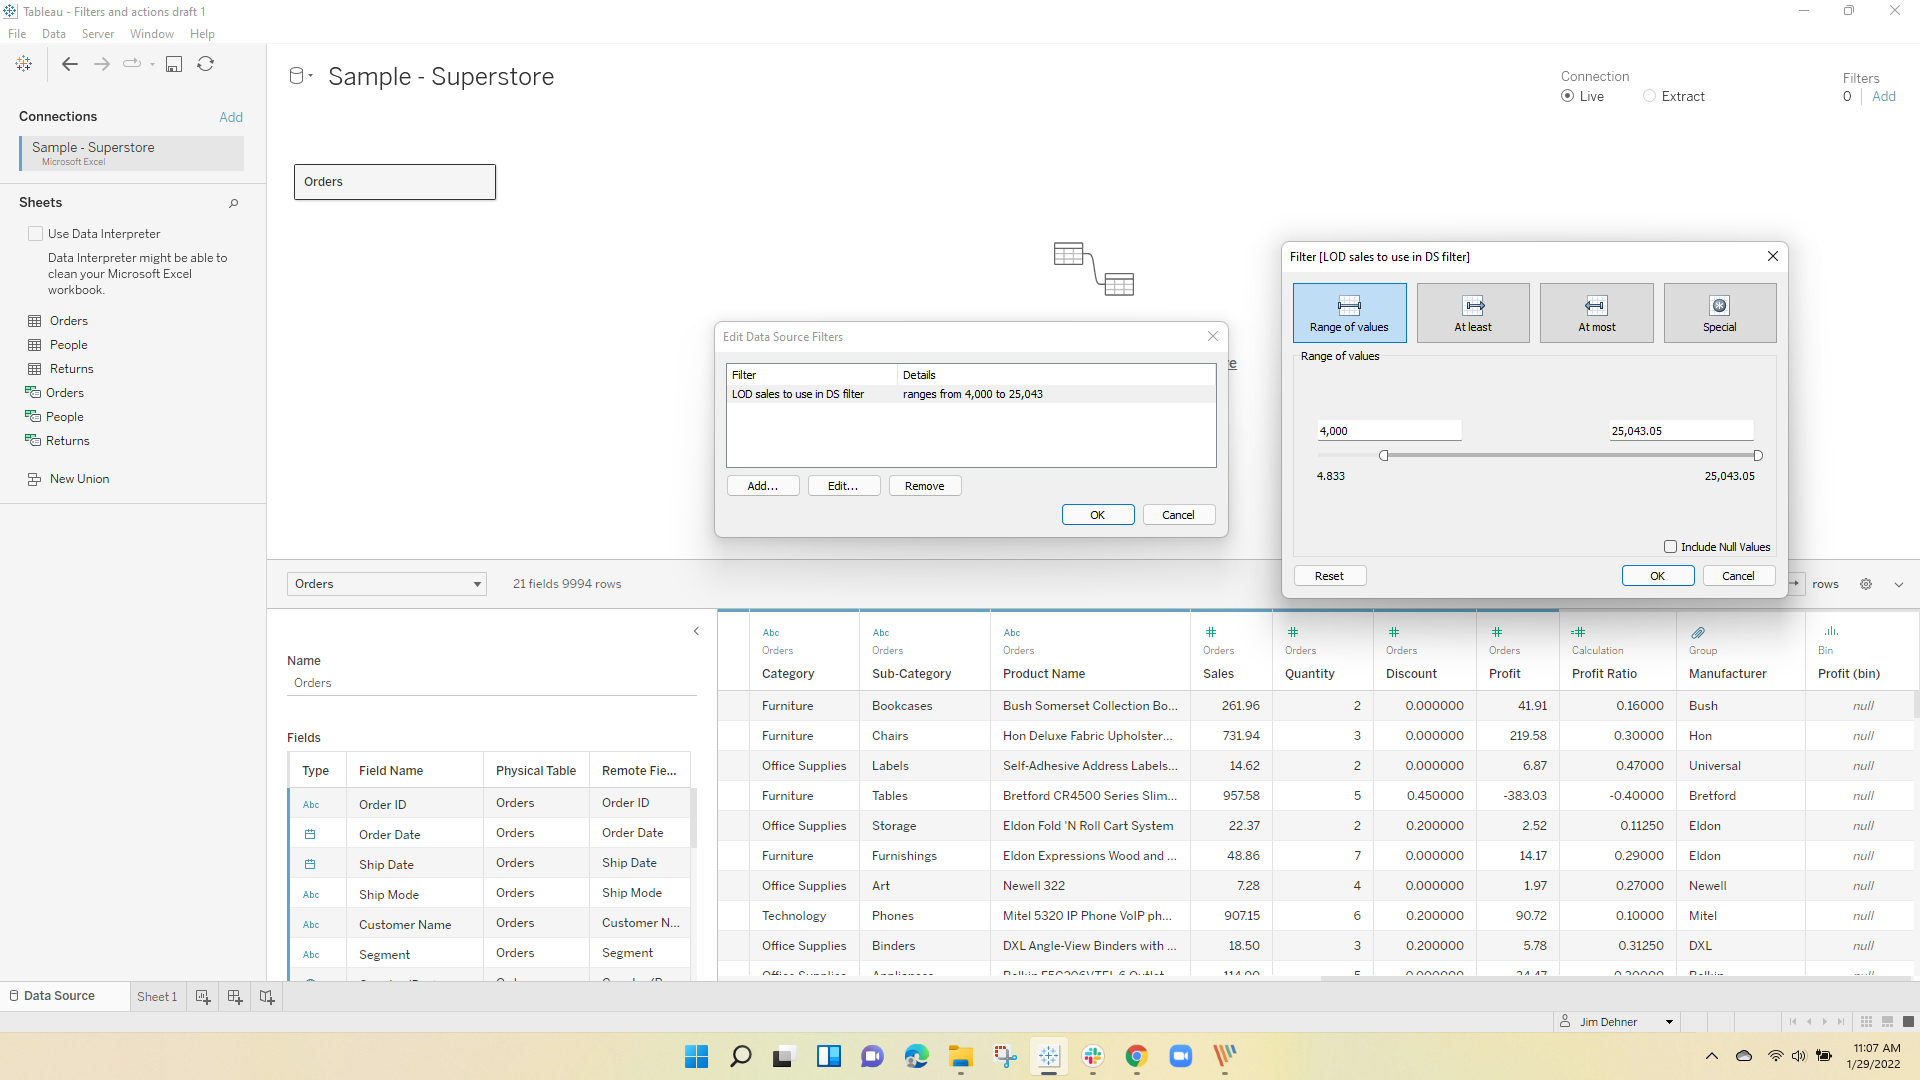
or even LOD's that have been previously created in the workbook can be used as filters
One caution, I know from experience, it is easy to forget that data source filters have been applied. When the results fail to meet your expectation, it may be data filtered out at the data source level causing the problem.
The remaining 4 filter types work at the worksheet level creating and modifying the data table for its unique data table. Each worksheet has its own data table, a subset of the total dataset that remains after the application of any data source or data extract filters. Context and dimension filters alter the structure of the data table. Measure and table calculation filters work on the values in the cells of the table.
Context and Dimension Filters
Context filters and Dimension filters change the structure of the worksheet data table by eliminating rows or columns. Context filters are applied before Fixed LODs, Sets and Top N's are calculated, Dimension filters after.
There are 2 layers to the worksheet data table. The summary layer is what you see in the viz and is composed of the aggregated value of the detail records from the "underlying" datasheets.
The "summary table" below contains 48 "Marks" that are the aggregated sum of the 10,000 detail records in the datasheets. The aggregation here, and in the following examples is Sum() and is at the Category/Region level.

Applying either a Context or Dimension filter to any dimension which is not visible will eliminate data from the detail sheets but, since the visual table is not changed the number of marks remains the same while their value changes.
Here, a Segment not in the view – "Consumer" is filtered out

If the filter is placed on any visible dimension in the view, both the detail and summary table are affected. Filter out the "Central" Region changes the structure of the data table
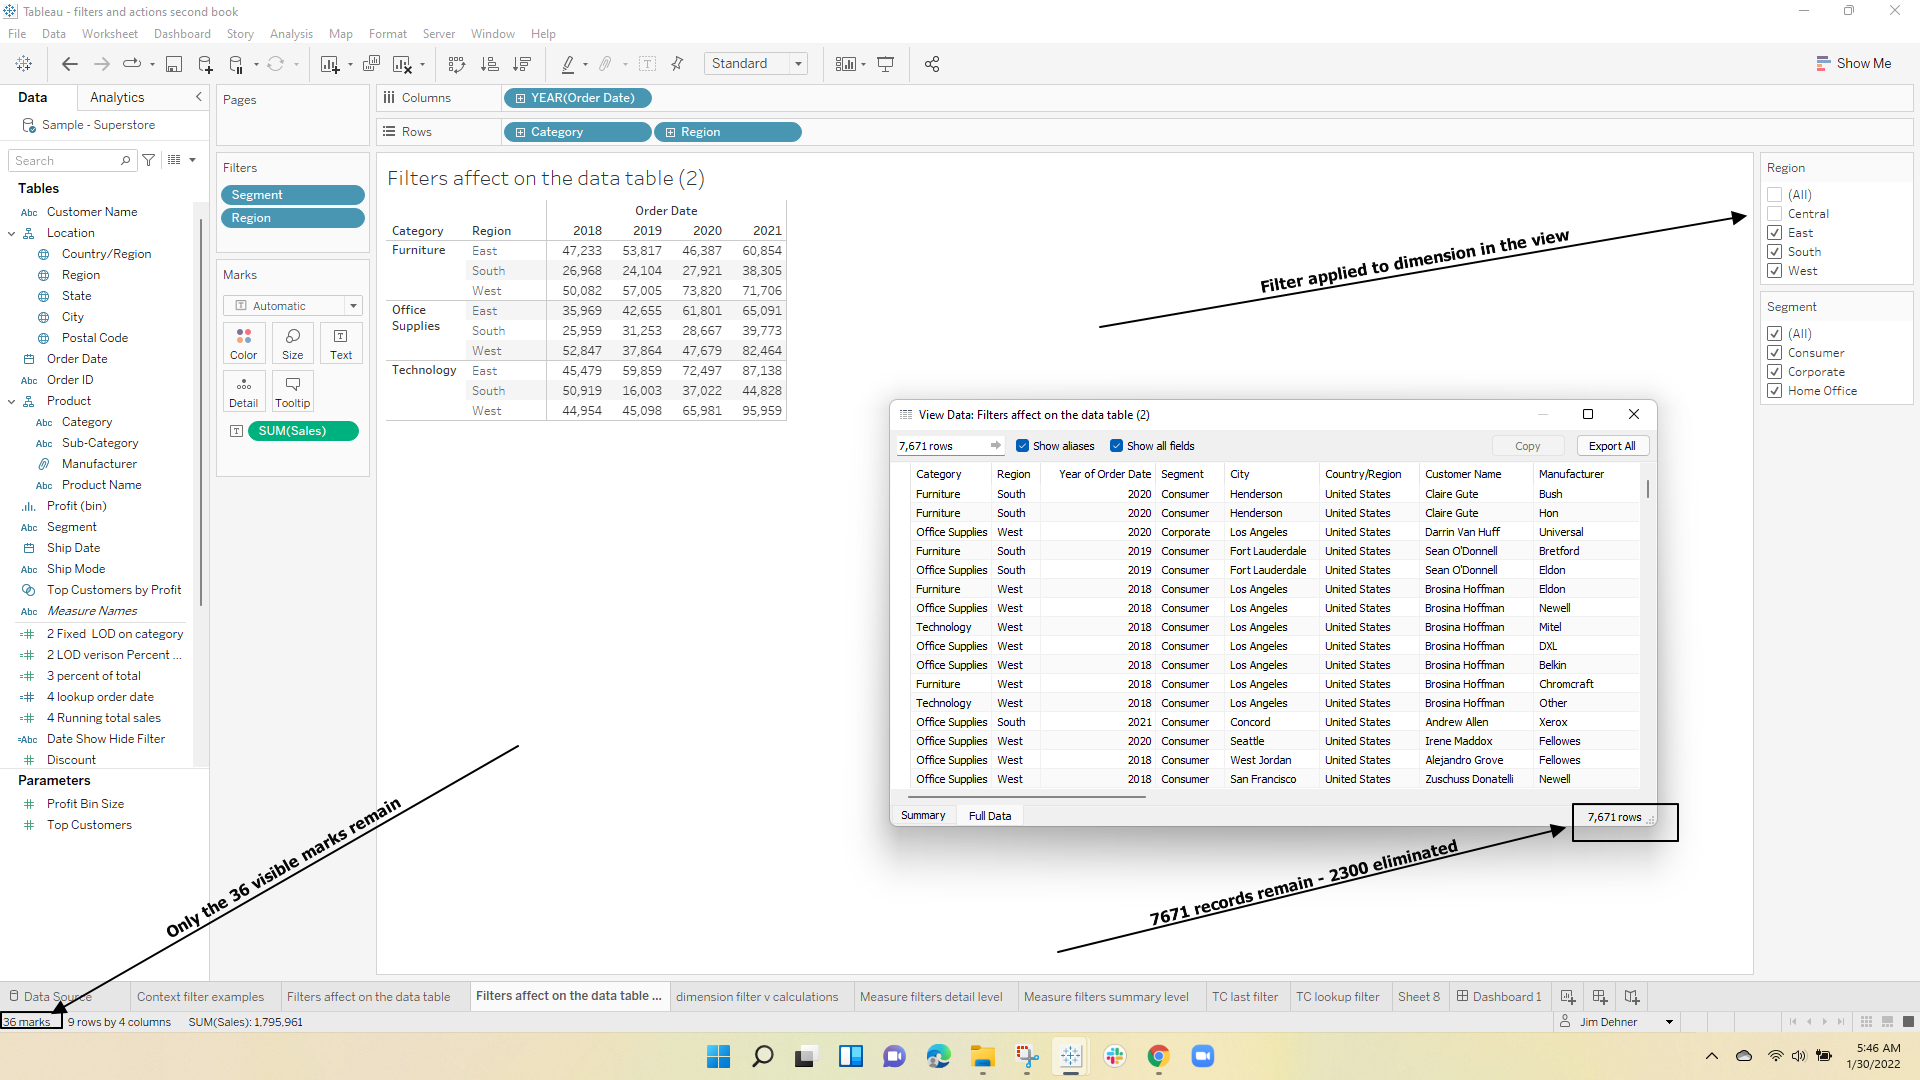
So why have both Context and Dimension filters if they each change the data table structure in the same way?
Context Filters
Using the Context filter alters the order in which filters are applied with respect to Fixed LODs, Set construction, or Top N calculations. Placing the filter "in Context" applies the filter first:
With Segment in Context filtering "Consumer" out happens before the LOD is calculated:
{ FIXED [Category]:sum([Sales])}
and the percent of the total category is
sum([Sales])/ sum([2 Fixed LOD on category])
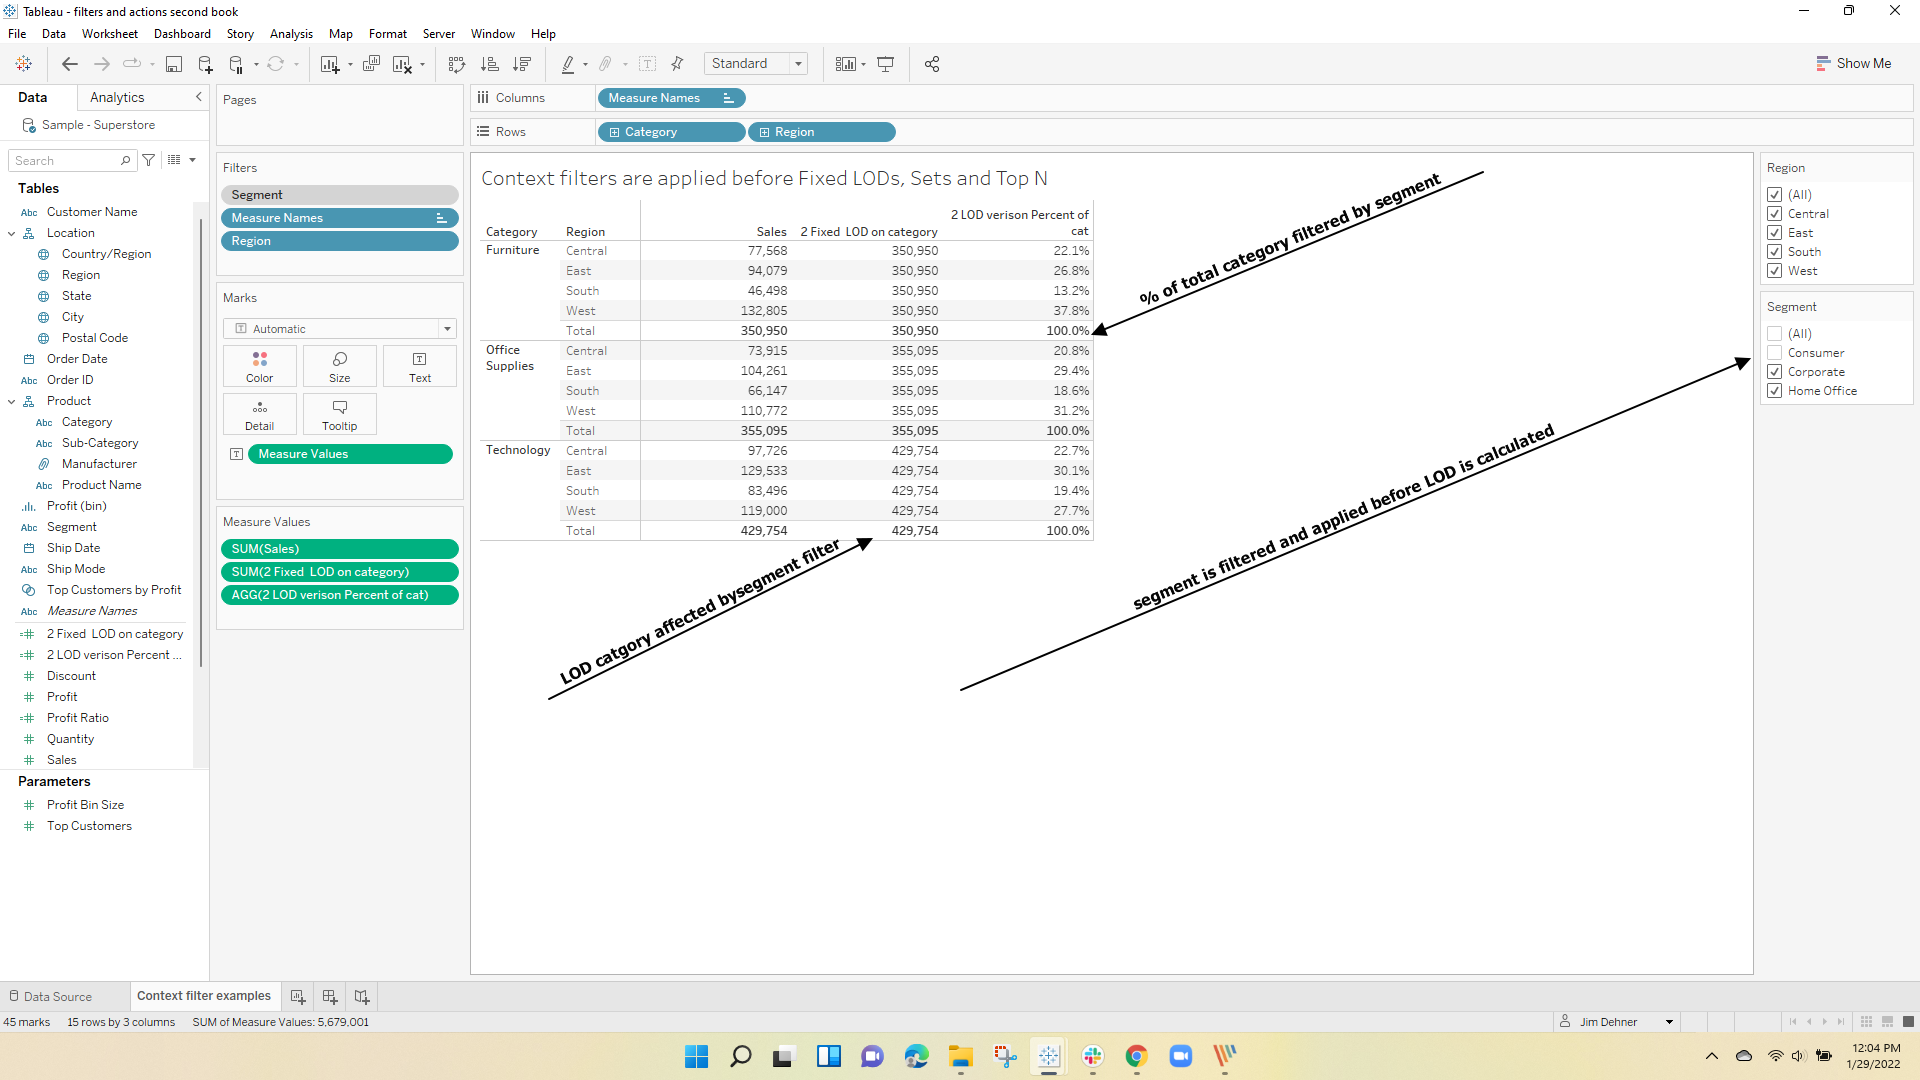
As a result, the value of each Region/Category combination (cell) is reduced as is the total overall. The percent of total using the LOD is now based on the values only from the "Corporate" and "Home Office" segments so each category total with return 100% and the Region values are the percent of the Category
On the other hand, if the filter is applied as a Dimension Filter after the LOD is calculated then the cell values are the sum of all 3 Segments including "Consumer".
Often users will ask for a calculation that "ignores" the filter – Tableau never ignores a filter or data – You determine when the filter is applied. If applied as a Dimension filter the LOD is calculated before the filter. If applied on Context the fileting takes place before the LOD is calculated

The same holds true for creating Sets and Top N and I encourage the reader to practice with some small examples to see the effect (also see Context filters – What do they really do? )
Measure Filters
Measure filters are applied to cell values – not table structure. The data table structure is set by step 5 in the order of operations. Subsequent steps load the table with values and perform calculations, filter, and total values within the data table (both summary and detail levels)
Measure filters can be applied at the detail level or the summary level as the Measure is added to the Filter Shelf using the "All Value" option or at the Summary level (visible level) in any of the several aggregation options available

At the detail level the "Measure Filter" filters out data on the underlying datasheet. Filter for individual records greater than 1000 reduces the detail data to only 468 records which are still aggregated to the 48 records visible in the viz.

Filtering the "Summary" data with a measure filter will affect both the visible and detailed tables:
Here Sum(Sales) has been filtered to greater than 15,000 There are only 45 marks in the table (3 have been 'filtered out') and 9800 records remain in the detail sheet – the 3 marks that are filtered out (East 2018 and South 2019 and 2020) were the result of aggregating only 200 detail records.

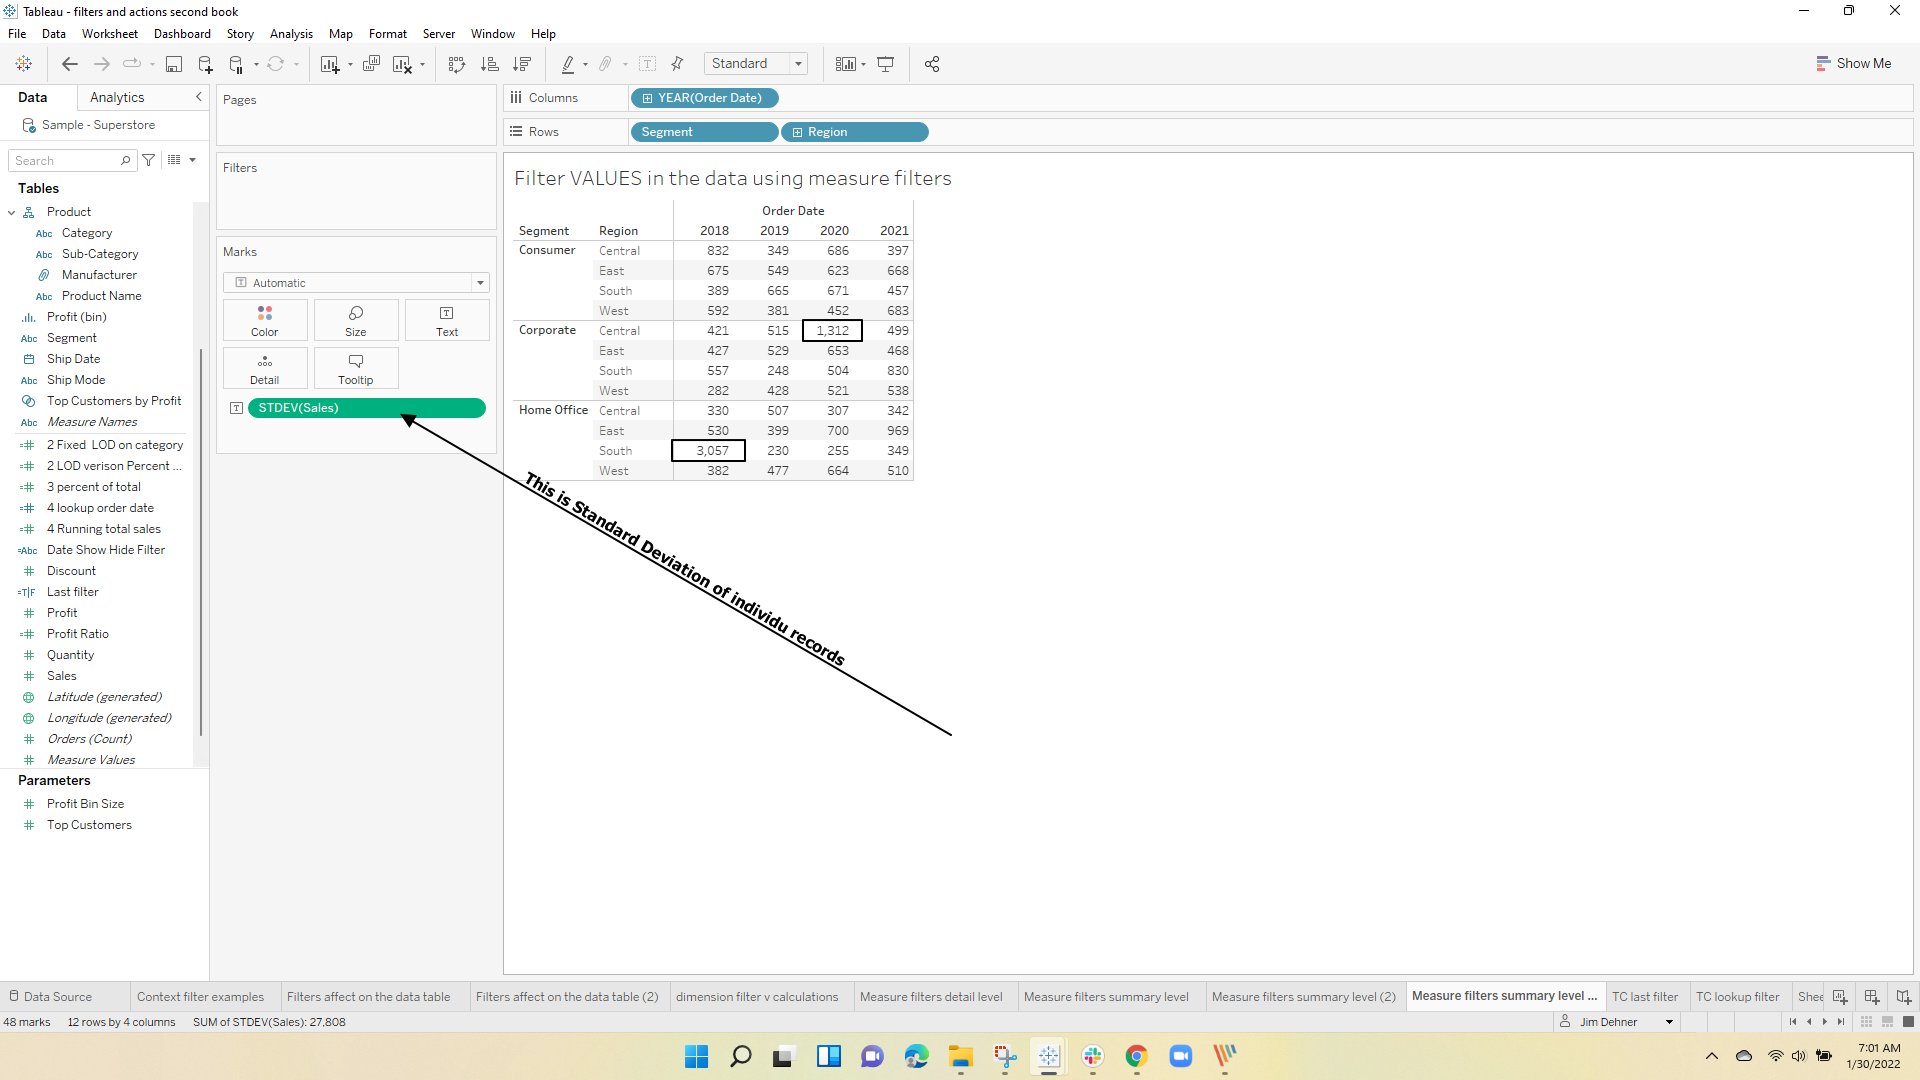
While Sum() is the default, many other types of aggregations are available – remember the aggregation function is how the detail records are aggregated and the value is based on that function – It does NOT need to be the aggregation visible in the viz:
Using the same data, this example uses the standard deviation of the detail records at the year/region level. It is created by just using the default Stdev function:
Note there are 2 values in the table with standard deviations greater than 1000.
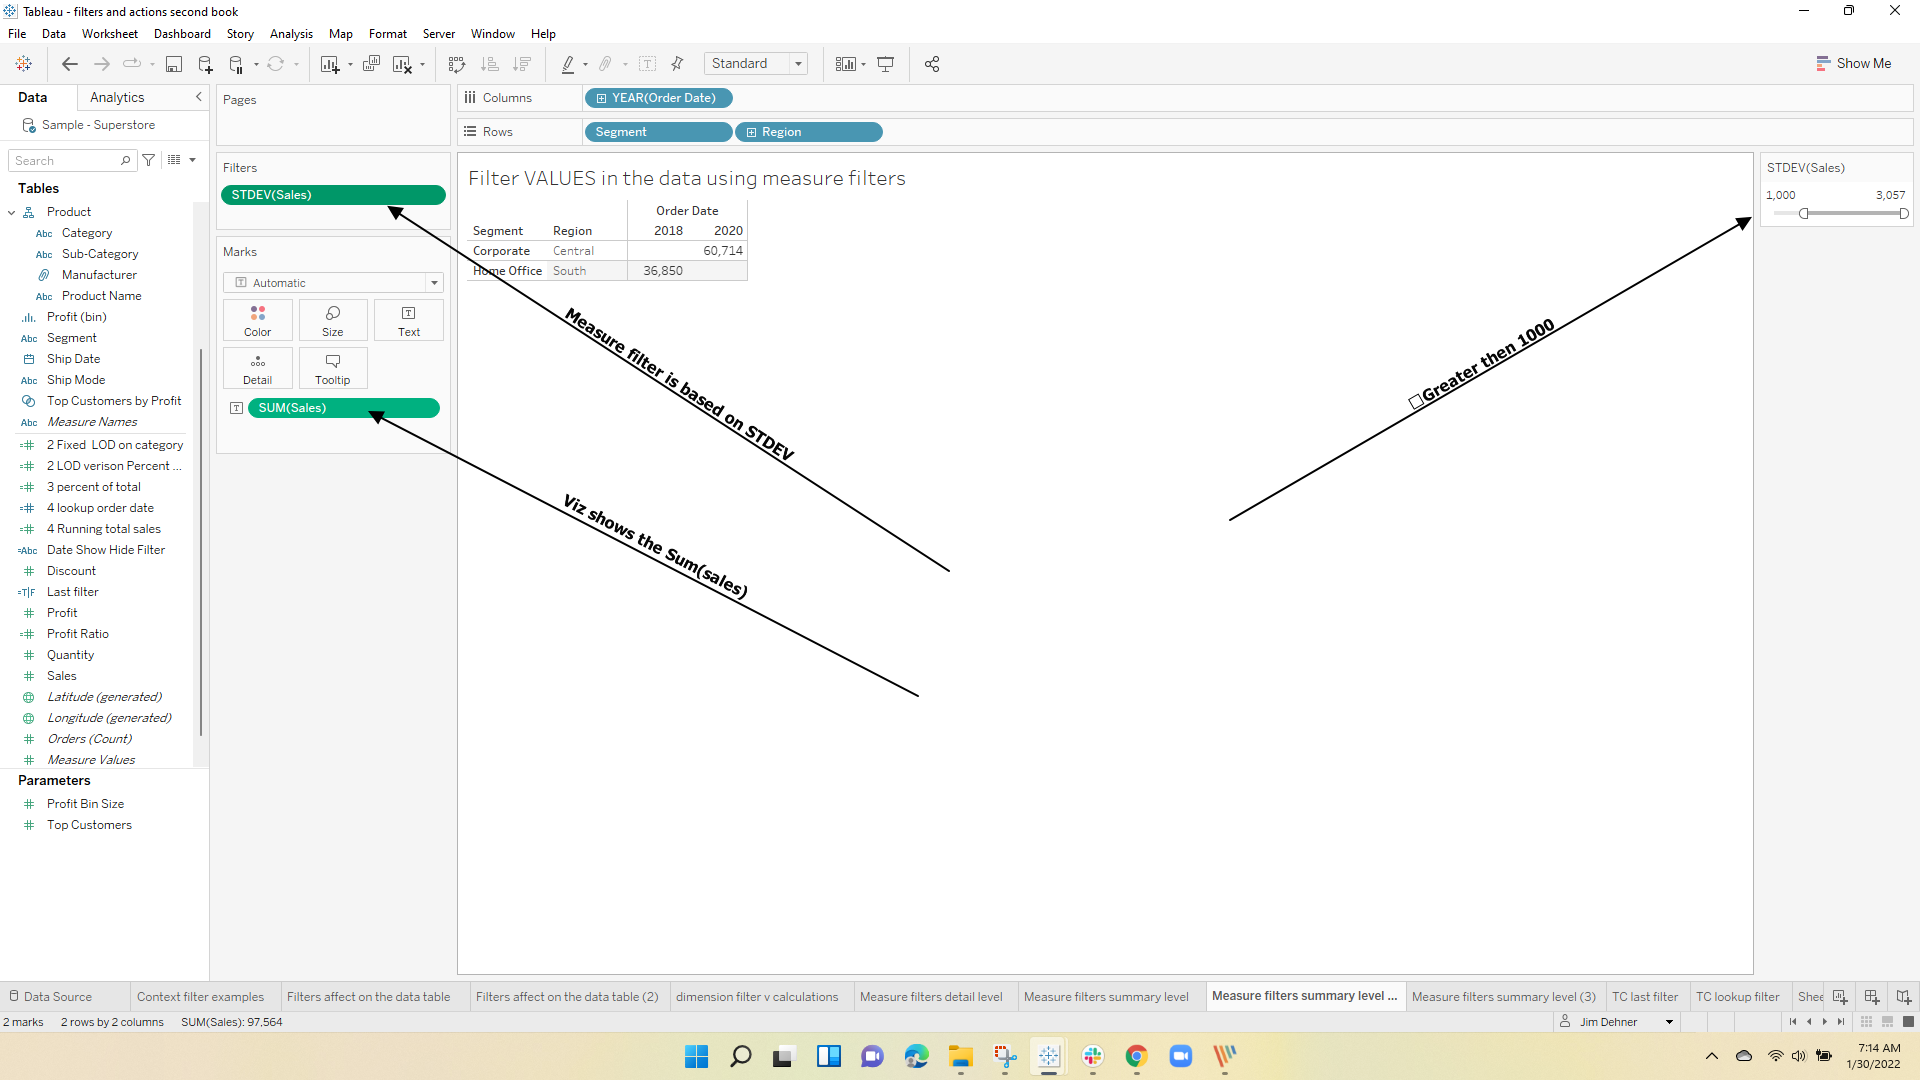
Now I want to see the sum of sales associated with those 2 combinations that have a greater than 1000 standard deviation. That can be found by using a STDEV measure filter while showing the sum(sales) in the viz:
Have some fun practicing with your own data!
Table Calculation Filters
The final filter type is Table Calculation filters (or Table Filters). Table calculations are last in the order of operation and often users want to filter the results of a table calculation (usually phrased as filtering the viz without affecting the underlying data). The only opinion available is to use another table calculation and the most frequent use is with Show/Hide filter – see Show – Hide Filters for a full discussion).
They are simply used to limit what is visible in the viz – like looking through a window –
This example uses a running total of category sales over time:

and the user wants to filter out the first year in but show the but not filter the running total. There are 2 ways – first using a First() filter to "Hide" the first 12 values in the viz
if first()>=-12 then "show" else "hide" end
While not strictly necessary, I like to use "show" and hide" in the calculation so when I revisit the workbook later I can remember what I did

an alternate approach is to use a Lookup function to create a filter ( see Table Calculations – When, Where and How for more on table calculations)
This just finds the Order Date of the current cell
lookup(attr(year([Order Date])),0)
and this will apply a filter based on the Looked up dates
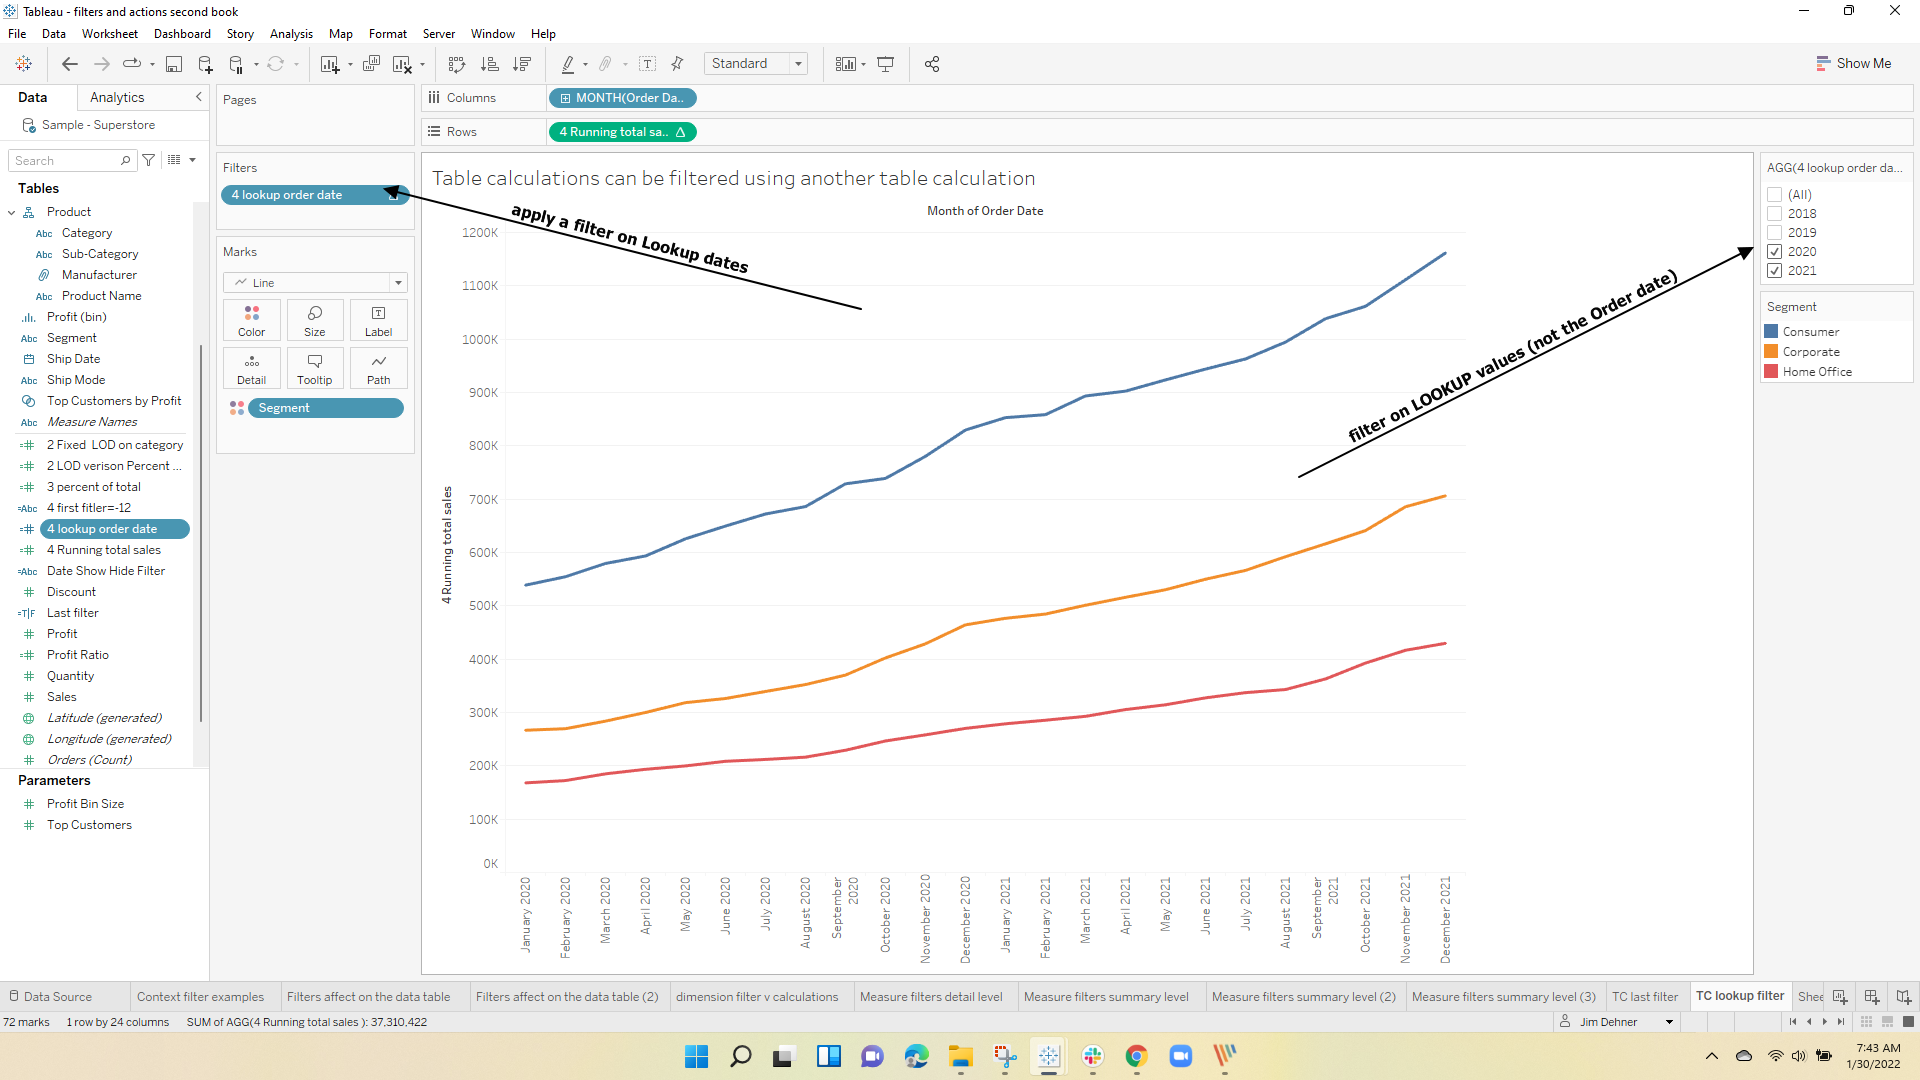
It is important to filter on the "Lookup" dates and to use the dimension Order Date as the columns
Hope this helps with your understanding of the 6 types of filters and when and how you would use each.
The workbook with these examples can be downloaded Filter Workbook to download
Enjoy
Jim
