
Session 8 – Custom Calculations Special Topic LOD Expressions
Level of Detail (LOD) expressions are unique to Tableau. Earlier we talked about the grain (the lowest level of data in the dataset. LODs are a way to put additional layers at higher levels of aggregation in the data.
See the video – Link to LOD Video
If you think of your data structure as a pyramid, fixed LODs allow you to combine dimensions to form another layer of data at that level.
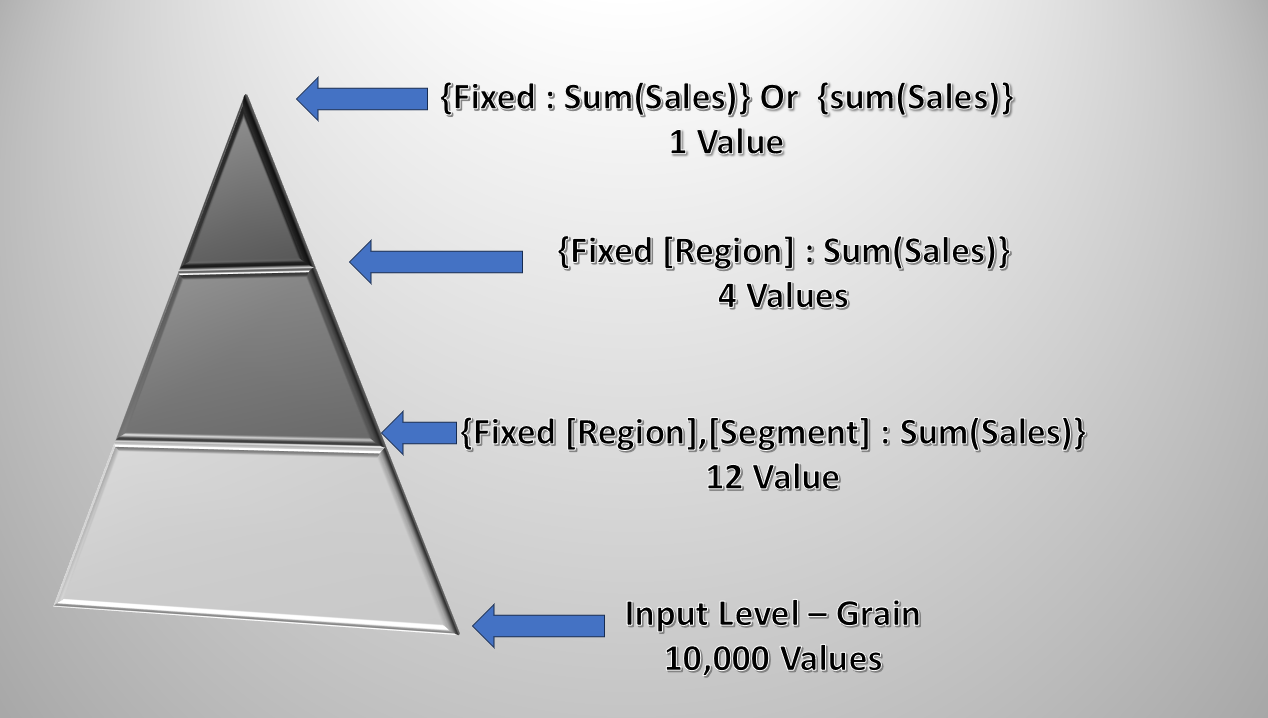
Using Superstore data there are 10,000 records at the base level – they are the row-level data from sales invoices. There are also 4 geographic Regions and 3 market Segments – a total of 12 combinations
{Fixed [Region],[Segment]: sum(Sales)}
Tableau maps and aggregates the 10,000 detail records into 12 records and the best part is the LOD is not an aggregate in itself so it can be used in any other calculation. Likewise, a LOD at the Region level will result in another layer with 4 values.
Very powerful!! So let’s look at some examples of where you can use LODs
The first is a replacement of a quick table calculation:
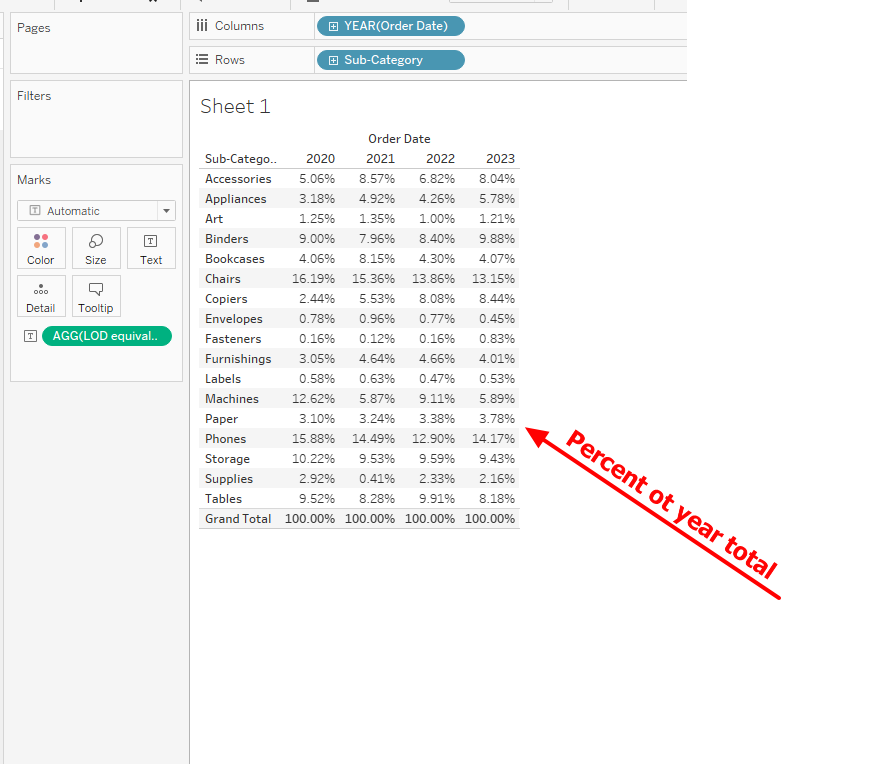
Here I have used the Quick Table Calculation “Percent of Total” to get the portion that each Subcategory sales are to the total for the year – (not to worry – we will go over the details in the next session on Table Calculations)

As you will learn, Table Calculations are great but limit some of the other things you can do – They are last in the Order of Operation so can not be used in LODs – But we can use a LOD equivalent
sum( { FIXED YEAR([Order Date]),[Sub-Category]:sum([Sales])}) /
sum({ FIXED year([Order Date]):sum([Sales])})
will return the same values. Great!
Take a moment to look at the formula – the numerator is at the Subcategory/year level – that is 17*4 or 68 combinations.
The denominator is at a higher level and returns the total for the 4 years. Also, notice that I had to aggregate the numerator and the denominator separately with Sum() and then do the division to get the results
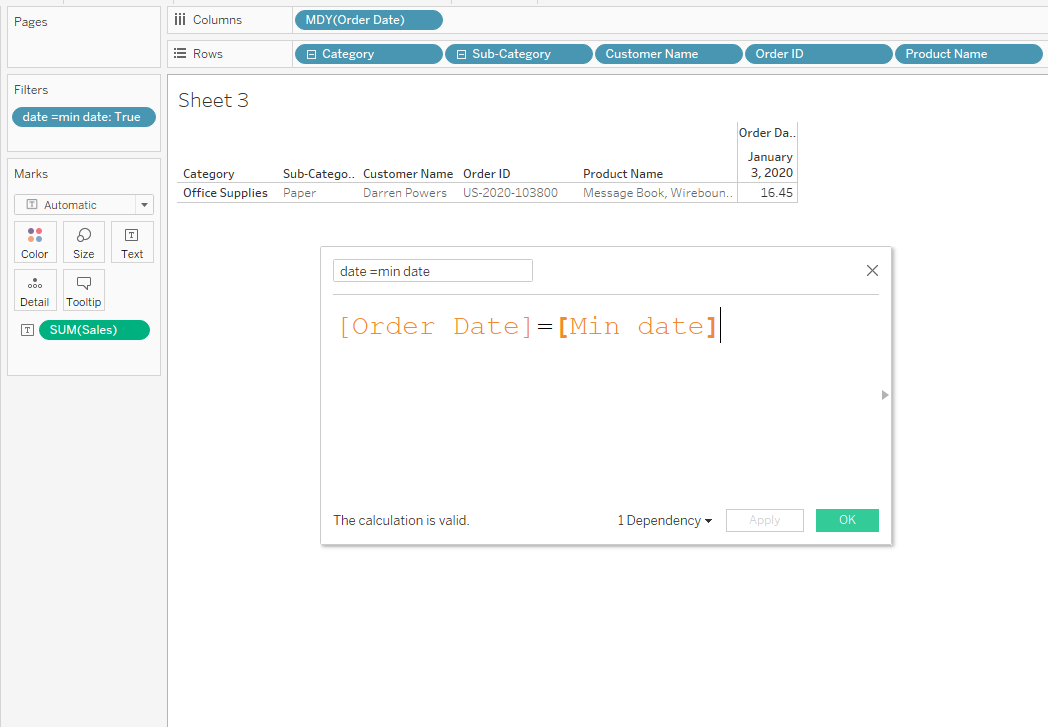
Often users want to find the first date or the last date of orders. This is a “Table LOD”
{Min([Order Date])}
It will find the first date in the entire data set

The expression can be used in a filter (as done here) or a conditional statement to find out what happened on that date: There was only a single order for Customer Darren Powers for $16.45
If we wanted to look at the first order in each category we could look at a lower-level Category dimension to the LOD
{Fixed Category: min(order date)}
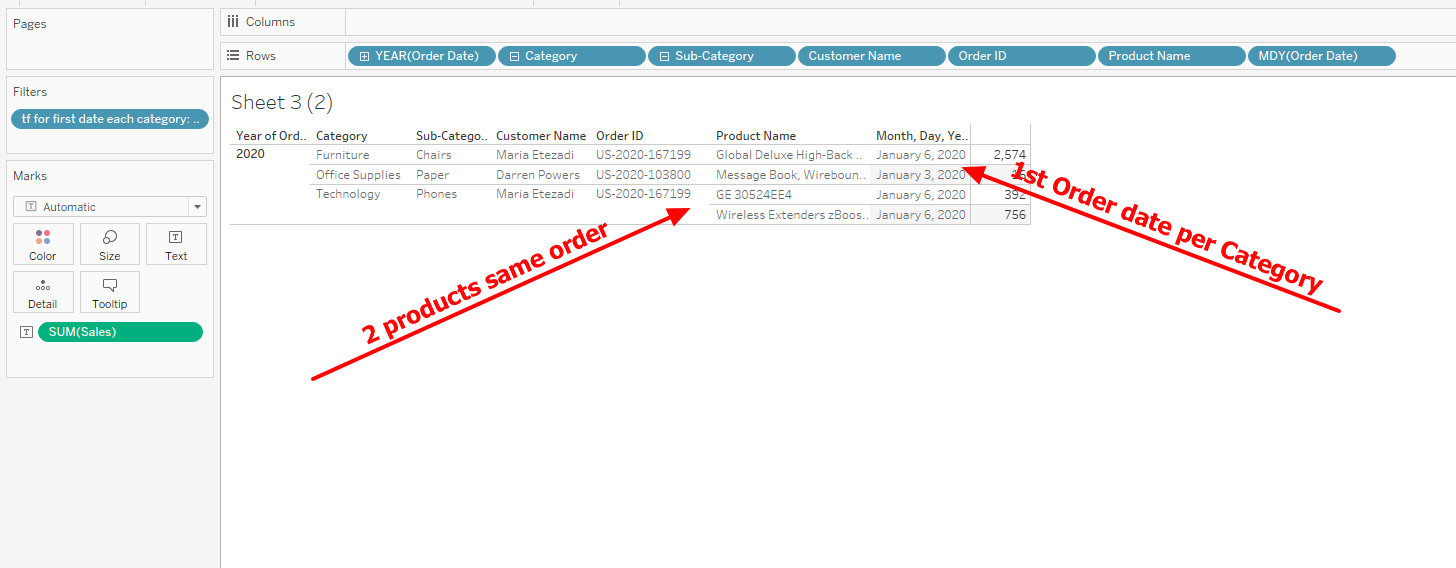
We see the first order date in each category and the details on orders for that Category – Day combination –
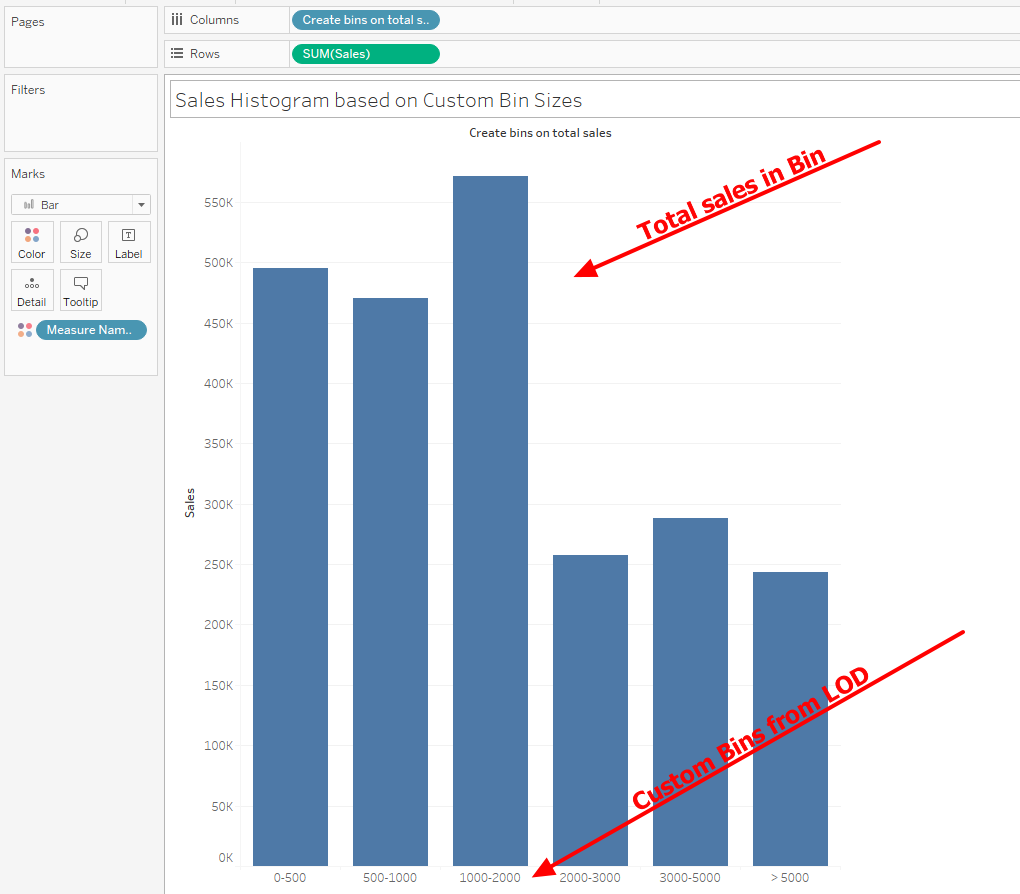
LODs are also good ways to create Dimensions – We often see users that want to create some custom bins – An LOD serves that purpose well.
This will create different size bins
{ FIXED [Order ID] :
if SUM(Sales)<500 then "0-500"
elseif sum([Sales])<1000 then "500-1000"
elseif SUM(Sales)<2000 then "1000-2000"
elseif SUM(Sales)<3000 then "2000-3000"
elseif SUM(Sales)<5000 then "3000-5000"
else "> 5000"
end }
to create a histogram
The results from an LOD are portable from one sheet to another to create a summary page or as BAN’s
One of my favorite uses it in period-over-period calculation – (This is just an example – see YTD and YOY Link for more detailed use cases)
Here we can find the YTD sales for the current and previous year –
This is the Current YTD formula which uses the date function Datetrunc from Session 7 –In words what the formula says is if the year of the Order Date is the same as this year and the date is less or equal to Today then total the sales –
{ FIXED : sum( if Datetrunc('year',[Order Date]) = Datetrunc('year', TODAY())
And Datetrunc('day',[Order Date]) <= Datetrunc('day', TODAY()) then [Sales] end)}
The same formula will be used to get the prior year except we look at last year by using the Dateadd function
{ FIXED : sum( if Datetrunc('year',[Order Date]) = Datetrunc('year',dateadd('year',-1, TODAY()))
And Datetrunc('day',[Order Date]) <= Datetrunc('day',dateadd('year',-1, TODAY())) then [Sales] end)}
Then it is just a matter of doing the math
The $ difference is:
sum(CY)-sum(PU)
And the Percent Growth is:
(sum(CY)-Sum(PY)) / Sum(PY)
To return this in summary

One last topic on LODs – How to apply filters and use the Context filter – (for a more complete discussion see Session 4 on the Order of Operation.)
Users get confused on when to apply the context – the simple rule is if you need the filter to affect the LOD place it in Context so it is applied before the LOD is calculated. If you want the LOD unaffected by the filter do NOT place it in context – it is no more difficult than that.
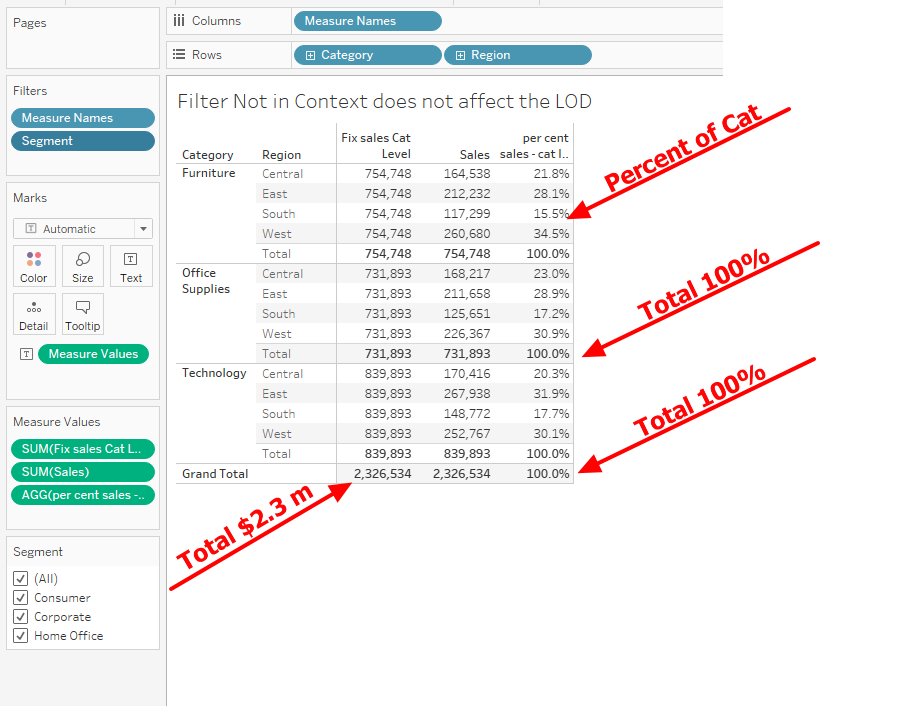
A simple example of percent of Sales by Category – and I will also apply a filter on Segment in Context and Not in Context
First the formulas and unfiltered results
Lod
{ FIXED [Category]:sum([Sales])}
Percent of Sales
sum([Sales])/sum([Fix sales Cat Level])
and the results
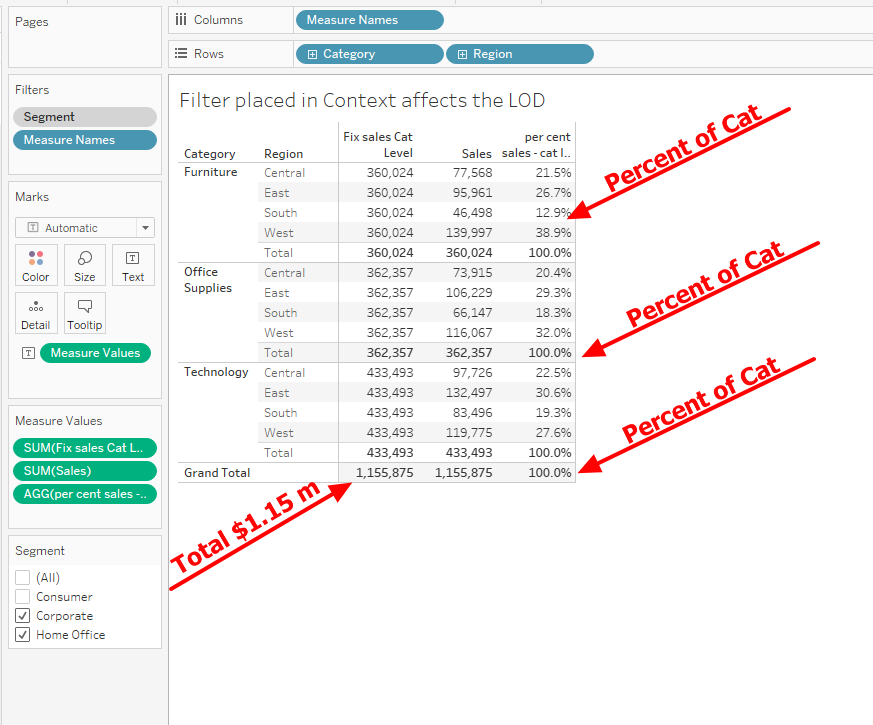
Now I will filter out Consumer with the Segment placed in Context (Gray pill) -–The Consumer Segment has been filtered out before the LOD is calculated – the total sales is $1.15 m – and the Category totals have changed accordingly as has the line level percent of the total.
If Segment is NOT in Context (Blue Pill) – the filter is applied after the LOD is calculated and the Percent of the total at the line, Category, and overall level is based on the $2.3 million total
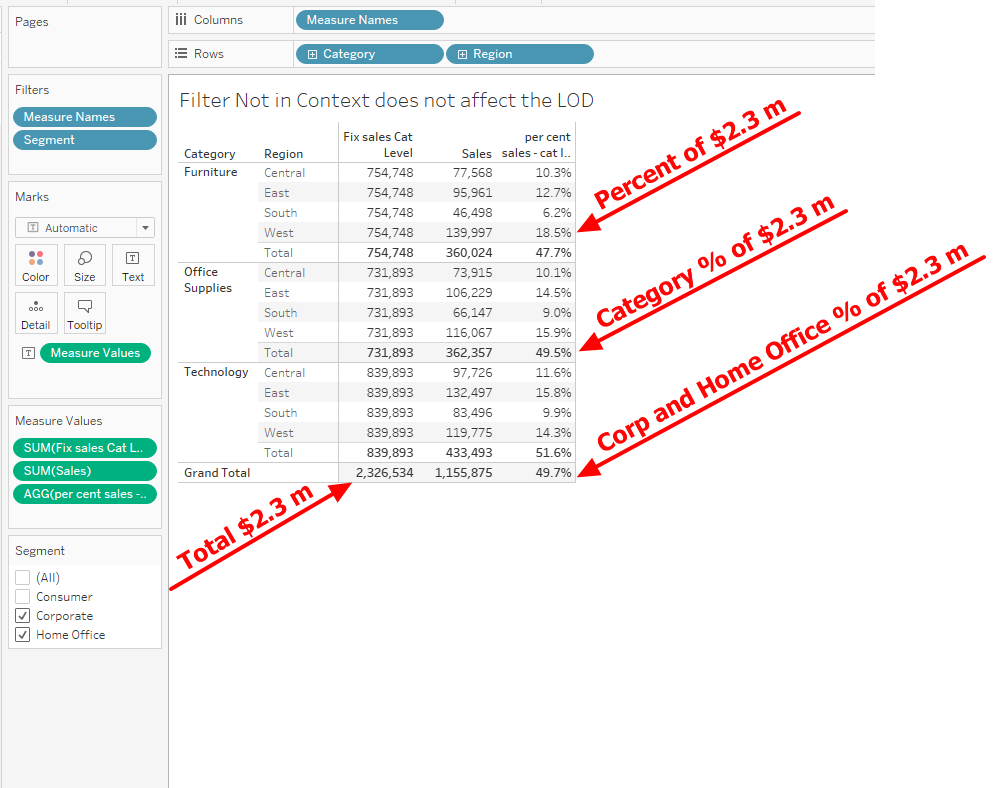
So which is correct –The answer depends on the goal of the calculation -If you need the percentages based on the total sales you would use the Blue (Dimension filter) filter – if you need the filter to remove values before the LOD is calculated then place it in Context – We consistent get request for formulas that “ignore” the filter –
I hope you understand that your role is to determine when to apply the filter and Tableau never ignores a filter – you make the decision
You may be thinking – what about Include and Exclude – very important LODs which were covered in Session 4 – the Order of Operation – see Session 4 link
There can be many more use cases but the only way you will understand LODs is by using them –
So now it is your turn.
