
Actions – you use them but do you know what they really do? The most frequently used ones simply change a value – that’s right – Granted some will take you places – like “Go to Sheet” or “Go to URL” – and you can highlight – But Filter, Set, and Parameter Actions just change a value in a filter, set or parameter.
Let’s start with an understanding of what Filters, Sets, and Parameters are and what they do
- Filters – remove (i.e. filer out) data from a worksheet data table
- Sets – divide the entire data table into 2 parts – the IN group and the OUT group – no data is eliminated
- Parameters are just values that must be used in a calculation or a filter – Alone the value doesn’t do anything – it is the filter or calculation that does the work
Filter Actions change the values in the filters on a worksheet – The worksheet can be stand-alone, on the current dashboard, or on a different dashboard – Note I keep saying filters apply to worksheets – each worksheet has a separate data table and filters work to remove data from that data table – making it unique to the worksheet – Dashboards are a collection of worksheets.
Sets Actions change the dimension values that are the “IN” group. No data is lost. The remaining values are the “OUT” group. Sets placed on one or more worksheets change at the same time as a result of the Set Action
Parameter Actions change the value of a parameter. Parameters are single-valued and global so changing a parameter makes changes in the calculations and filters throughout the entire workbook when the parameter value is changed
OK now that we understand the concept let’s look in detail at how each action is set up and used
1 Worksheet and Dashboard Action Setup
Actions can be set up on worksheets or dashboards. Start by opening the appropriate name on the top ribbon 1- Then select Action – 2
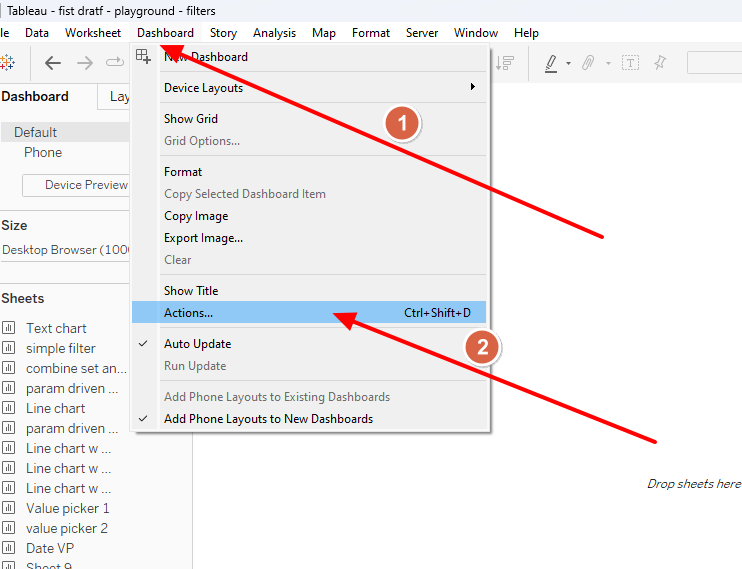
A window will open – click on Add Action – 3 and a second window will open allowing the selection of the type of action you want to add 4
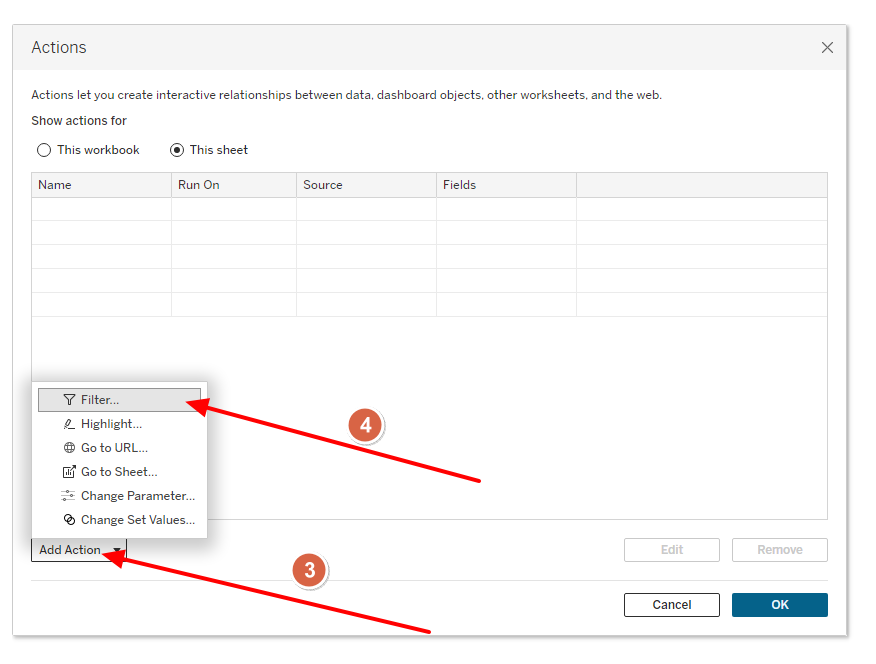
Easy enough – now let’s get specific about Filter Actions
2 Filter Actions
I will use the Superstore dataset (it is the one that came with your copy of Tableau)
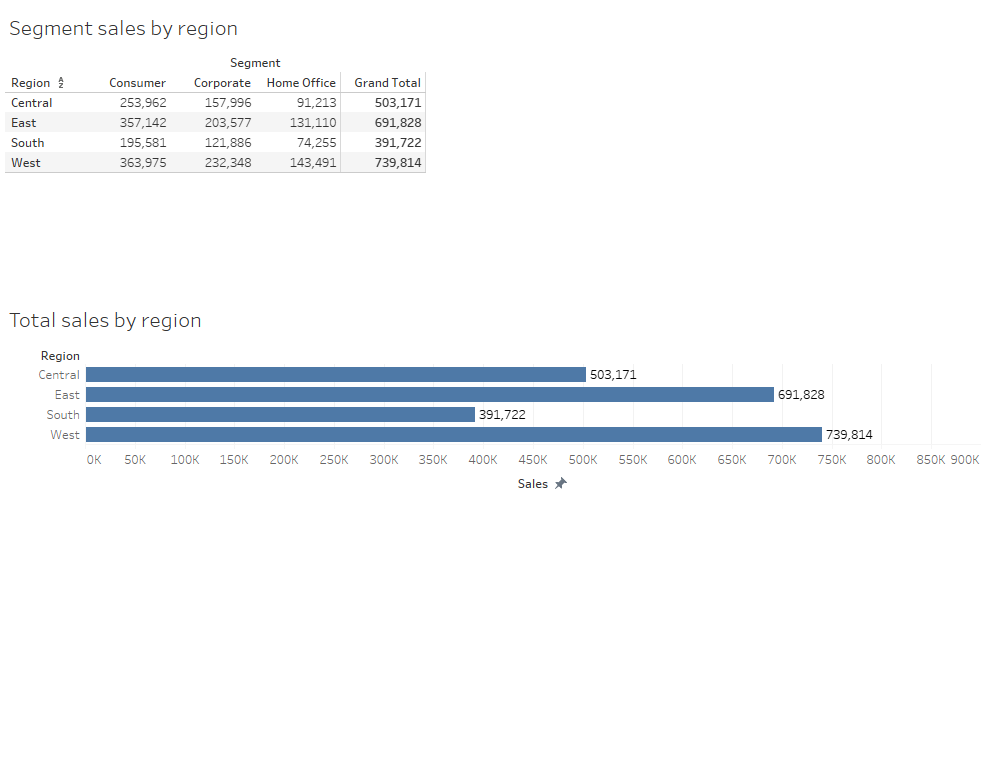
We’ll start with a simple text table which I will filter (manually first) to illustrate the effects of filtering on the data table

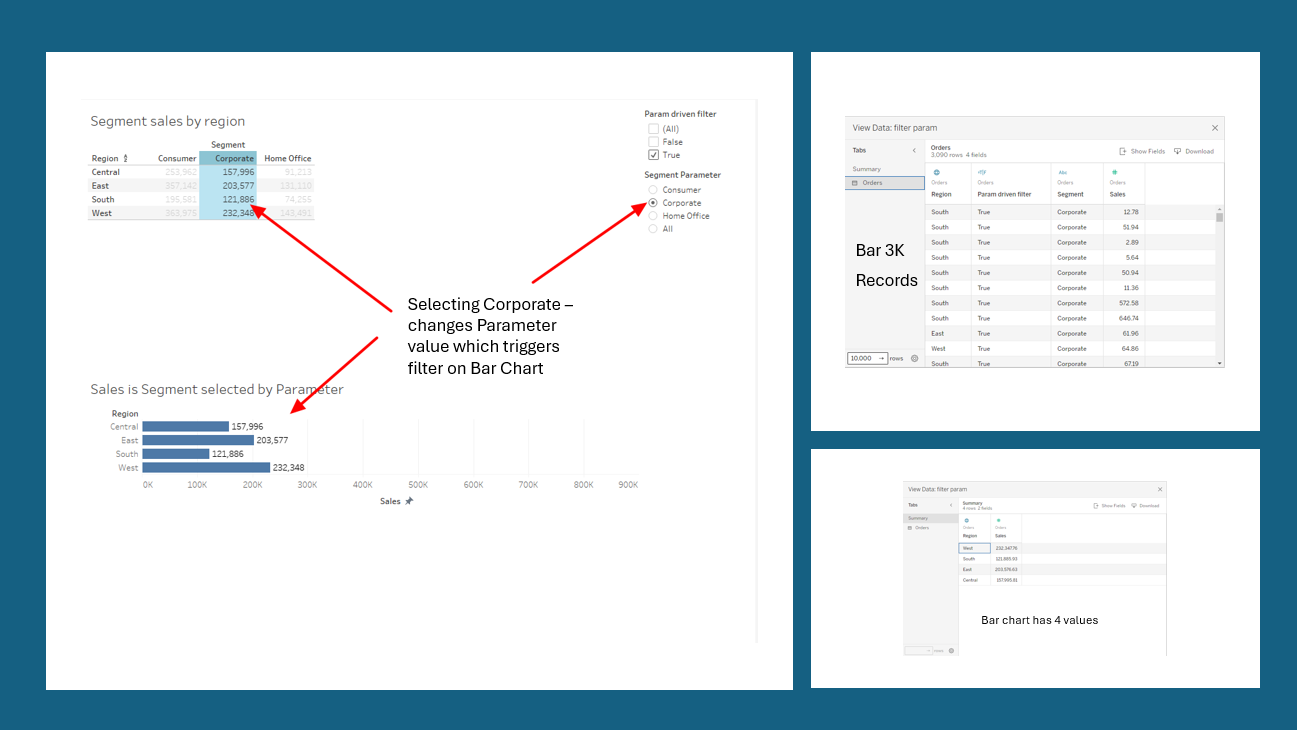
Without applying filters there are 12 “Rows” of data (think pivoted data) visible in the table – the “underlying” table contains all 10K records of in the Superstore dataset
When filtered to “Corporate”, there are only 4 rows of data visible, and the underlying table now is 3K records. The other 7K records are “filtered out” and not available on the worksheet –
Now let’s add a bar chart – place them both on a dashboard and add an Action filter
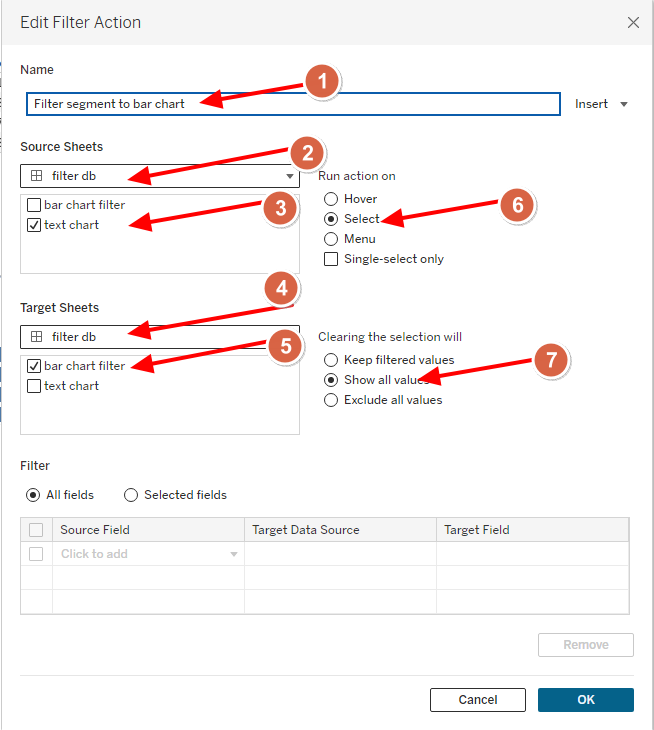
And the setup for the Action Filter looks like this
-
- The Filter Action is named “Filer segment to bar chart”– so we can find it later
- The Action starts on the Filter dashboard
- It goes from the worksheet named Text Chart
- The Action ends at the same Filter Dashboard
- It is applied to the Bar Chart Filter
- It runs when the user selects (clicks) on a mark on the Text Chart worksheet
- When the Selection on the Text Chart worksheet is cleared – all values will be added back in
Selecting Corporate in the Text Chart and the Filter Action applies the filter to the Bar Chart –
Not only do the bar lengths reflect the Corporate sales in each region- but when we open the data table for the BAR CHART worksheet – there are only 4 rows visible and the underlying data has 3K records
3 Set Actions
How are Set Actions different – using the same example with one addition – I’ve added a set on Segment
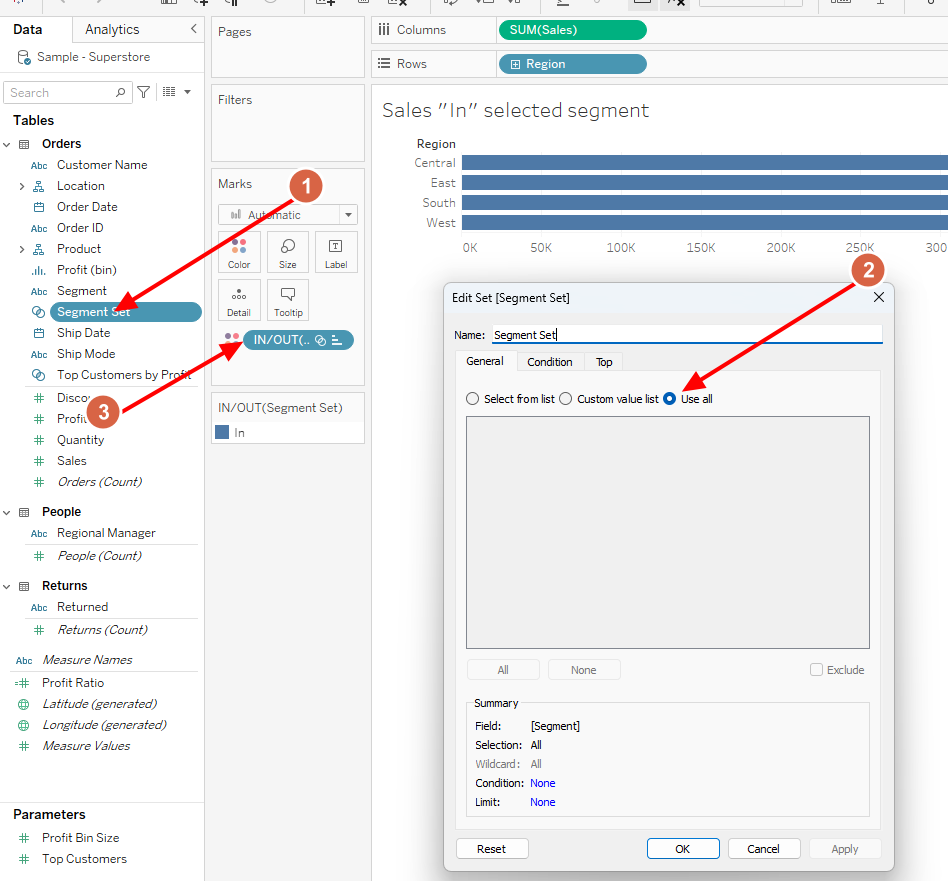
Setting up the set is easy
-
- Select Segment and “Create Set
- The “Use all” on the General tab
- Drag the Set to the Color Tile
Start with a new dashboard adding a new Text Table and the bac chart including the set – the set up the Set Action

-
- Give the action a Name
- The Set DB is the source where the Set Members will be selected
- Select the set members from the Text Chart worksheet on the dashboard
- The set to be changed is Segment Set we created (you can choose from the drop-down if there is more than one)
- The selected members will replace any existing members in the set
- The Action will execute by Selecting (clicking on) marks in the Text Chart
- When the selections are cleared (clicking again on the Text Chart) all members will be placed IN the set
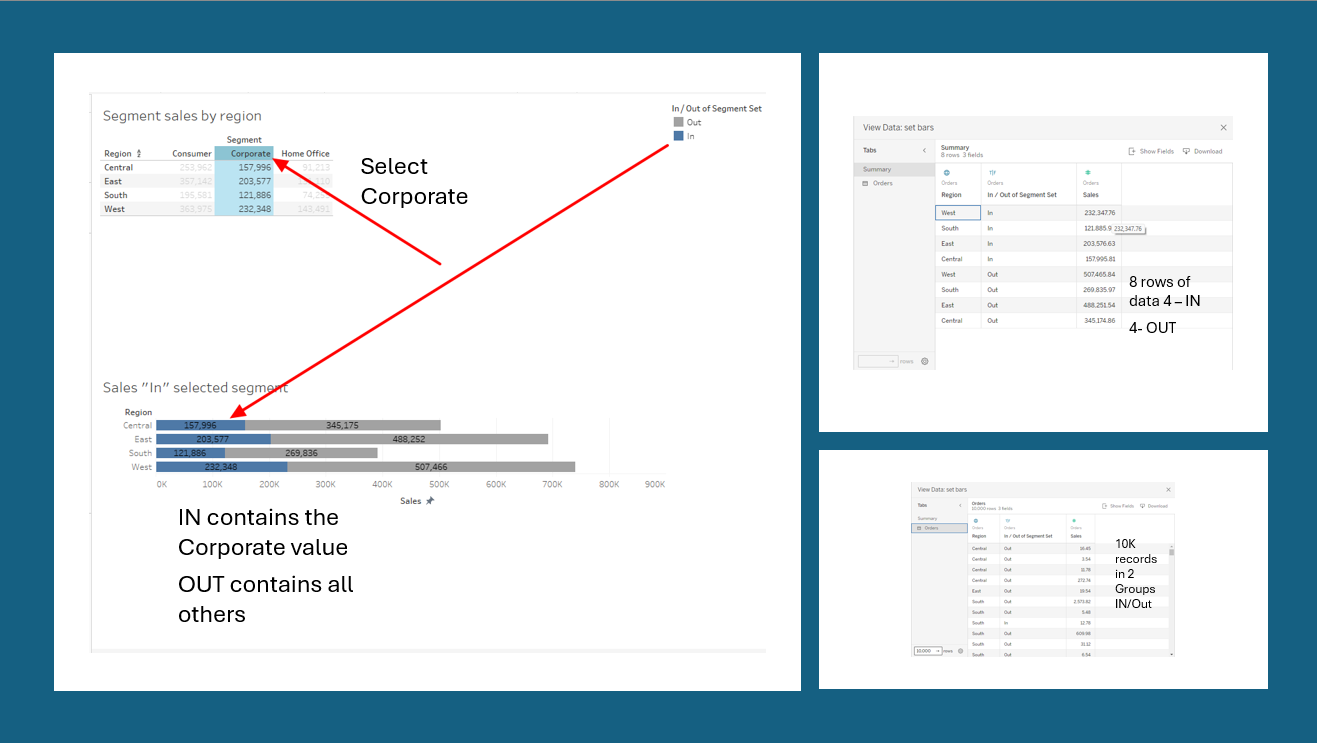
Adding the Corporate to the IN Set on the Text table sections the bar chart into IN and Out Segments – if we look at the data table for the BAR worksheet – there are 8 rows – 4 IN and 4 OUT but the underlying table remains a 10K records – no data is lost – just categorized as IN records or OUT records.
4 Parameter Actions
Parameter Actions simply change the value of a parameter – but it is the filter or a calculation where the parameter value is used that does the actual work.
Using the same data, I created a parameter of the segment that is then used to filter the data – the parameter setup is:
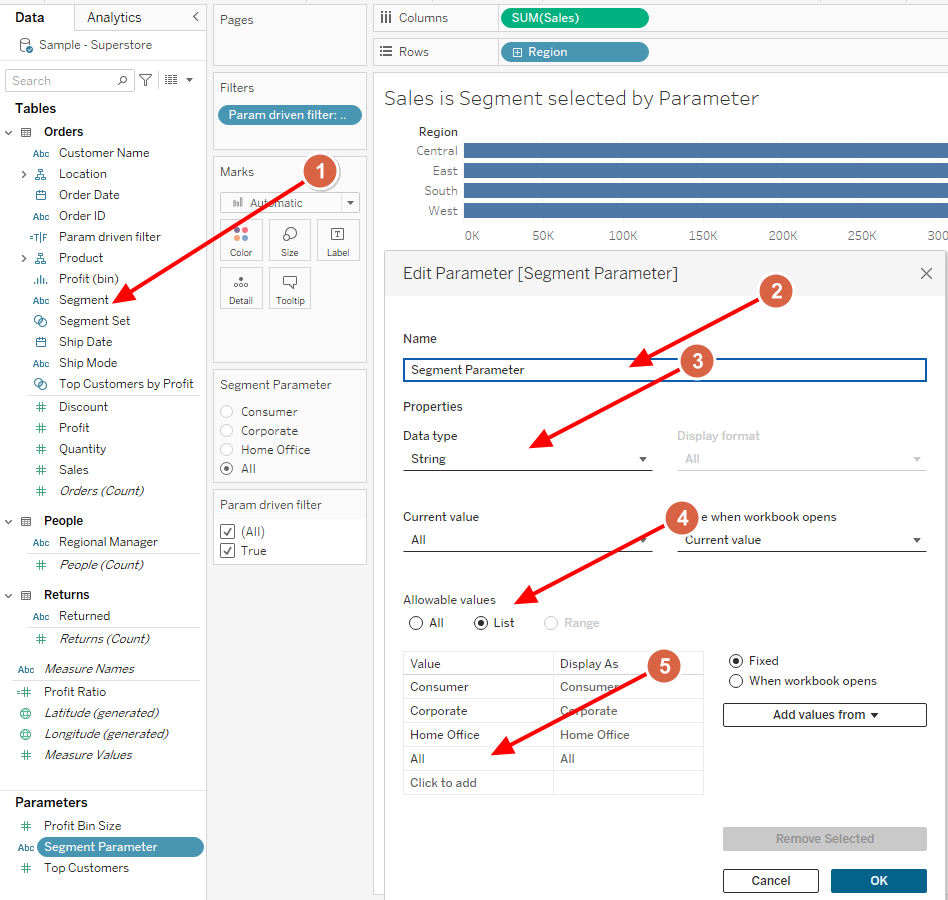
-
- Open Segment and Select Create Parameter
- Give the Parameter a Name
- It is a String (text)
- Only accept values from the list
- Manually added All to the list
Then create a Boolean calculation that will be used as a filter and add it to the filter shelf set to True
[Segment]= [Segment Parameter] or [Segment Parameter]="All"
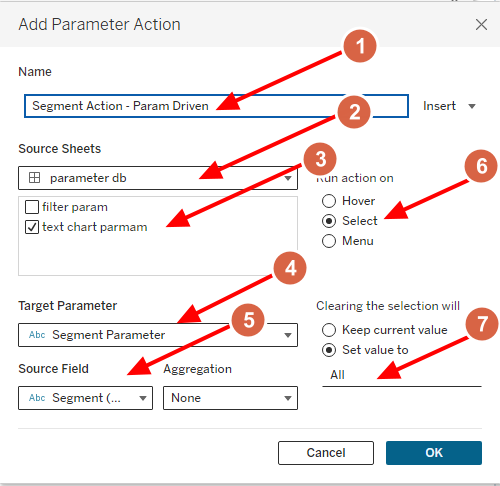
Now we need to set up the parameter action:
-
- Give the Parameter Action a Name
- The new parameter values will come from the Parameter Action dashboard
- From the Text Chart Param on the dashboard
- Change the values in Segment Parameter – parameter (selected from drop-down)
- The Dimension that is changing is the Segment dimension value
- The Action is executed on a Selection (right-click)
- When the selection is cleared (right-click again) change the Parameter value to All
Note the last point is how you see all bars in the chart when no Segments are selected in the Text chart
Selecting Corporate on the Text charts changes the Segment Parameter value and causes the filter on the BAR chart to filter to Corporate – only 4 records are in view and the underlying data as expected 3k number of records.
OK so that is how Filter, Set, and Parameter Actions are set up and used – — let’s look at some typical use cases:
5 Using Filter Actions on some but not all dimensions
Actions triggered by marks on Viz will filter all dimensions tied to that mark. Continuing with the example we have used.
Selecting the mark from the Text chart that is the intersection of East and Corporate will filter the Bar chart for both dimensions when the Filter Action is set up as shown:
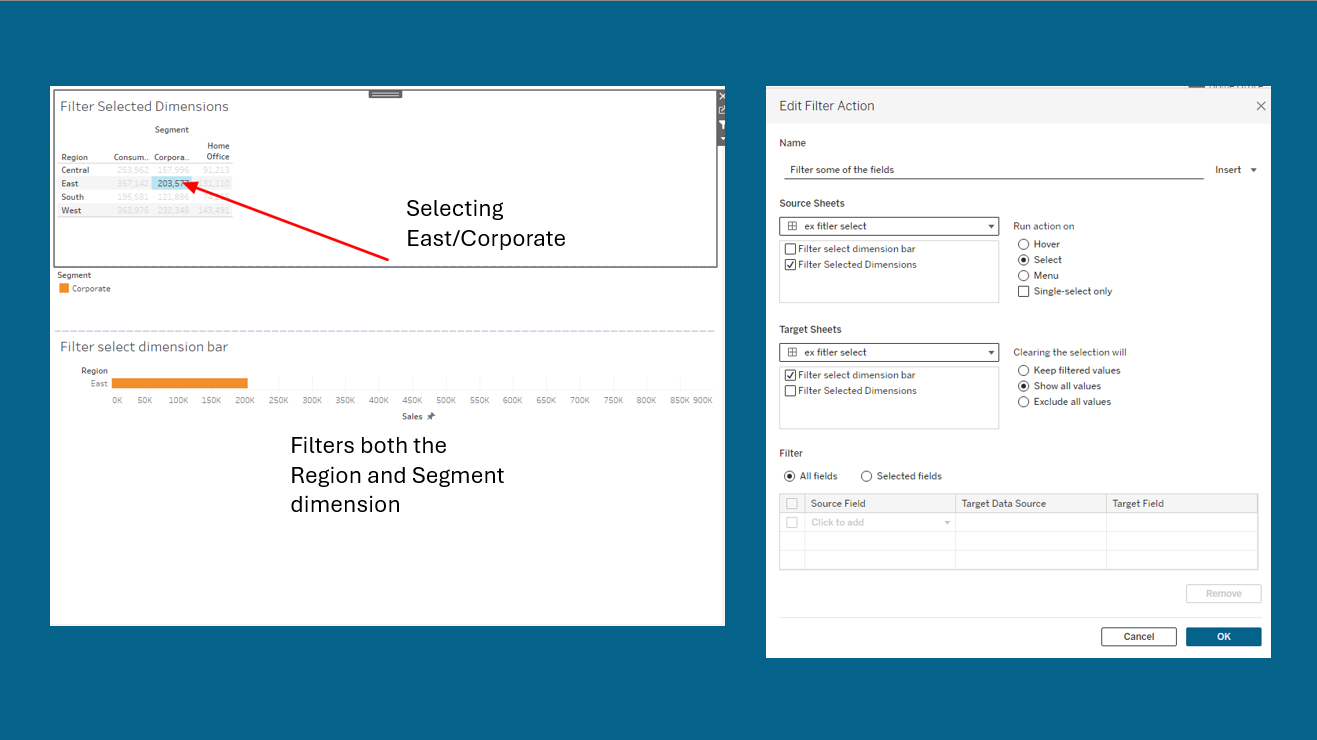
But that might now be what you wanted – you need to filter for the Region only but not the Segment.
That can be done using the lower grid on the Filter Action setup:
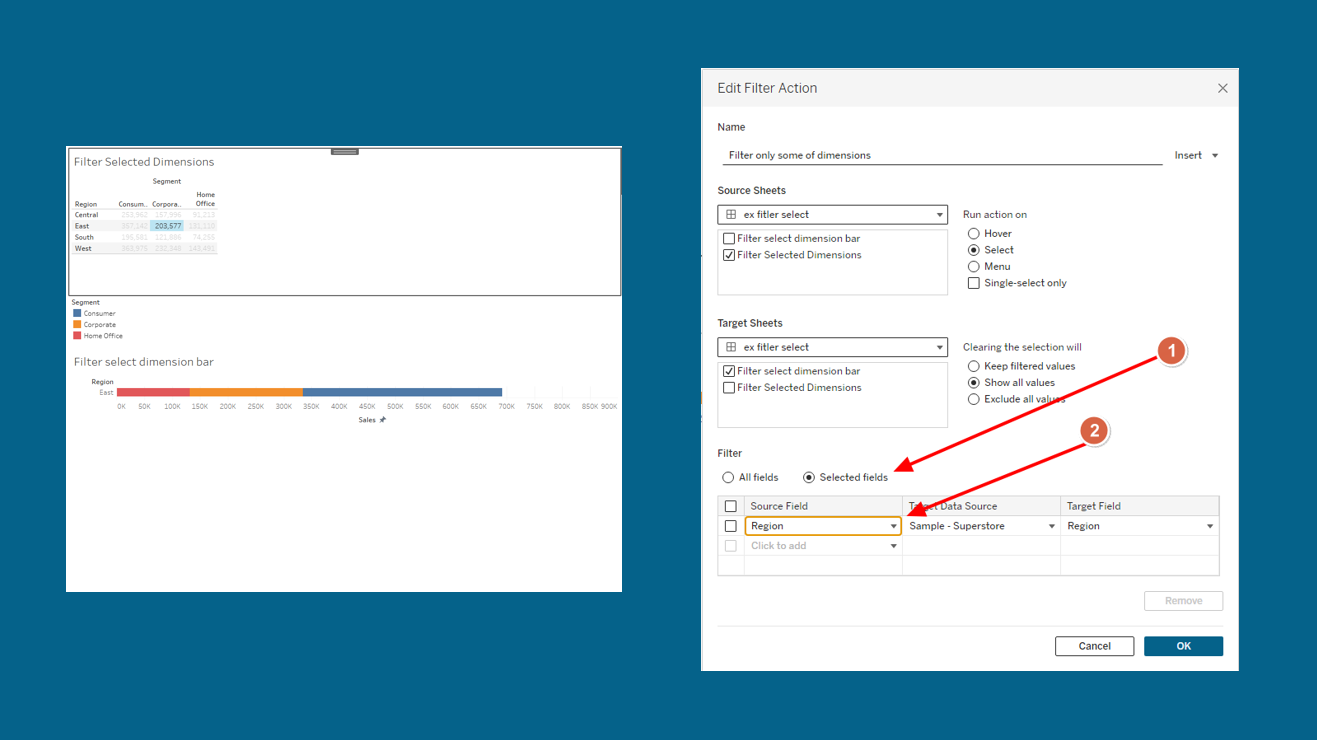
- Select the radio button “Selected Fields”
- Select the dimension that you want to filter going to the Bar chart
6 Value Pickers
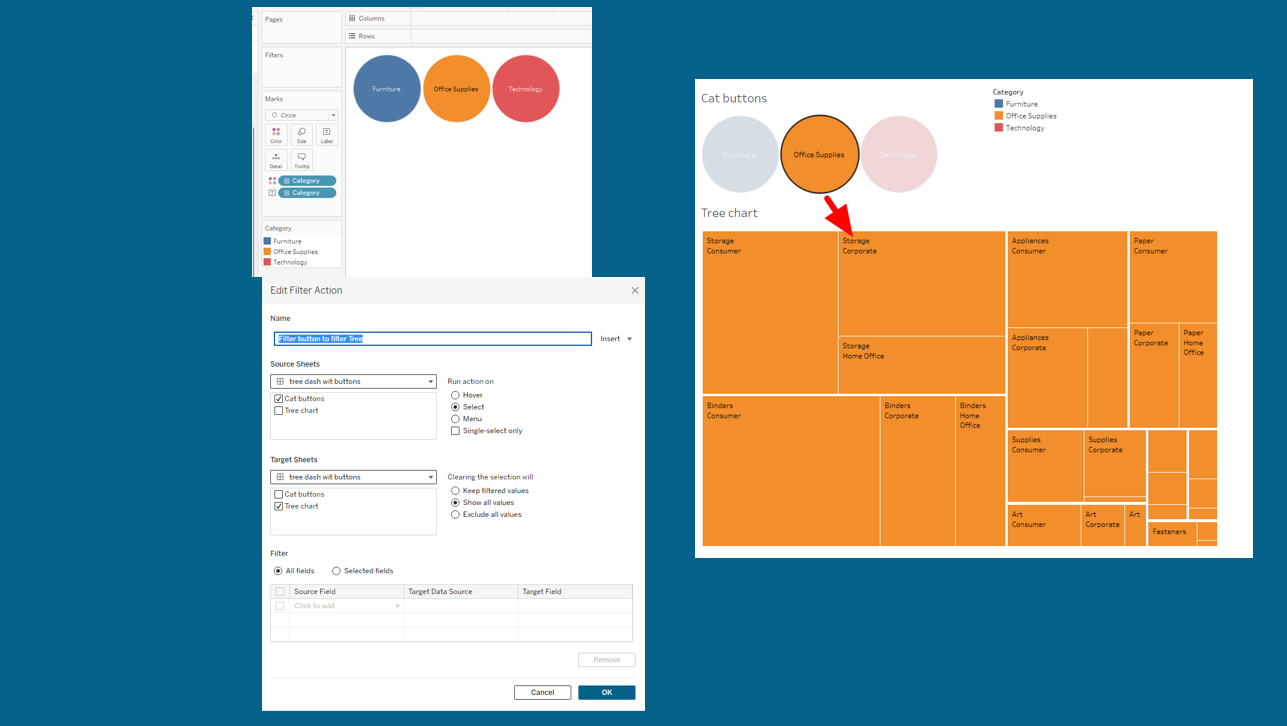
Up to this point, we have used actual marks in a chart to trigger an action. That’s good but you may want to be more creative and use buttons or other images to trigger actions.
Easily done – Here I used a circle chart as the Value Picker – Select a Category and filter the Tree Chart –
I use maps as value pickers whenever possible. –
Here the US map is the Value Picker and passes the State(s) selected to the Top N Bar Chart and Percent to Total Text chart
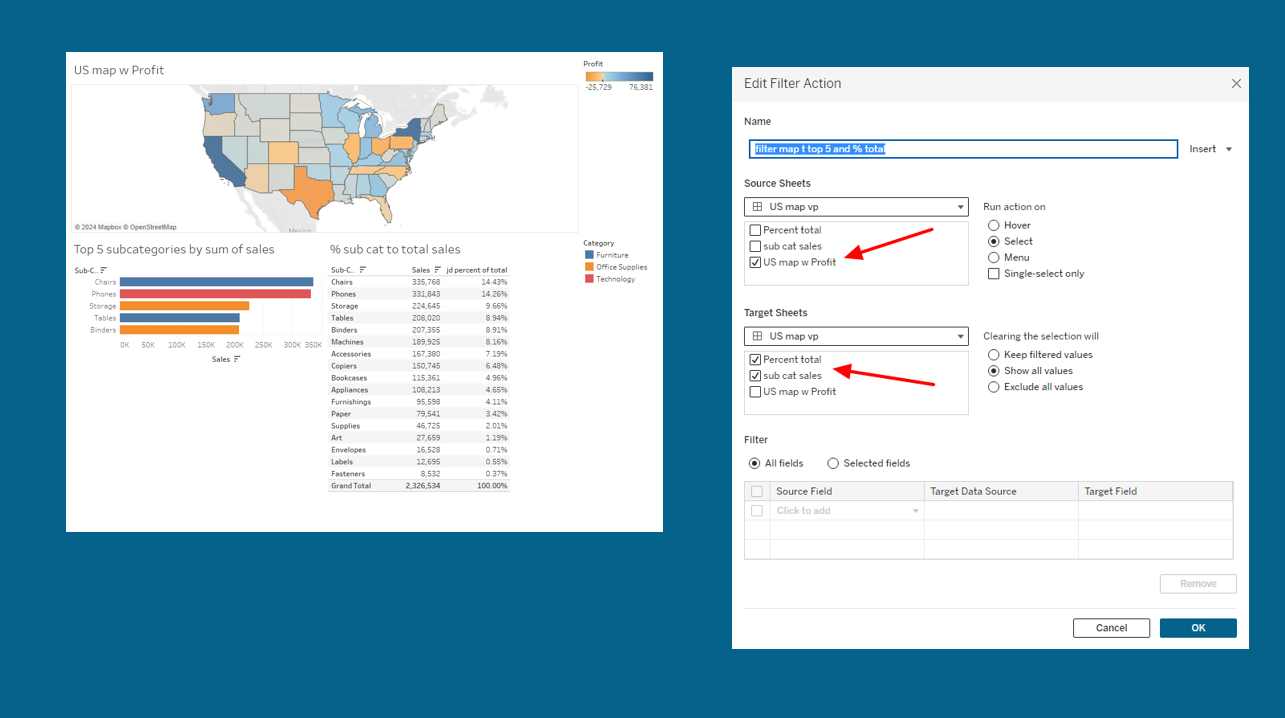
I’ve selected California, Texas, and New York. See the effect on the Top 5 and the % of Total but something doesn’t look right
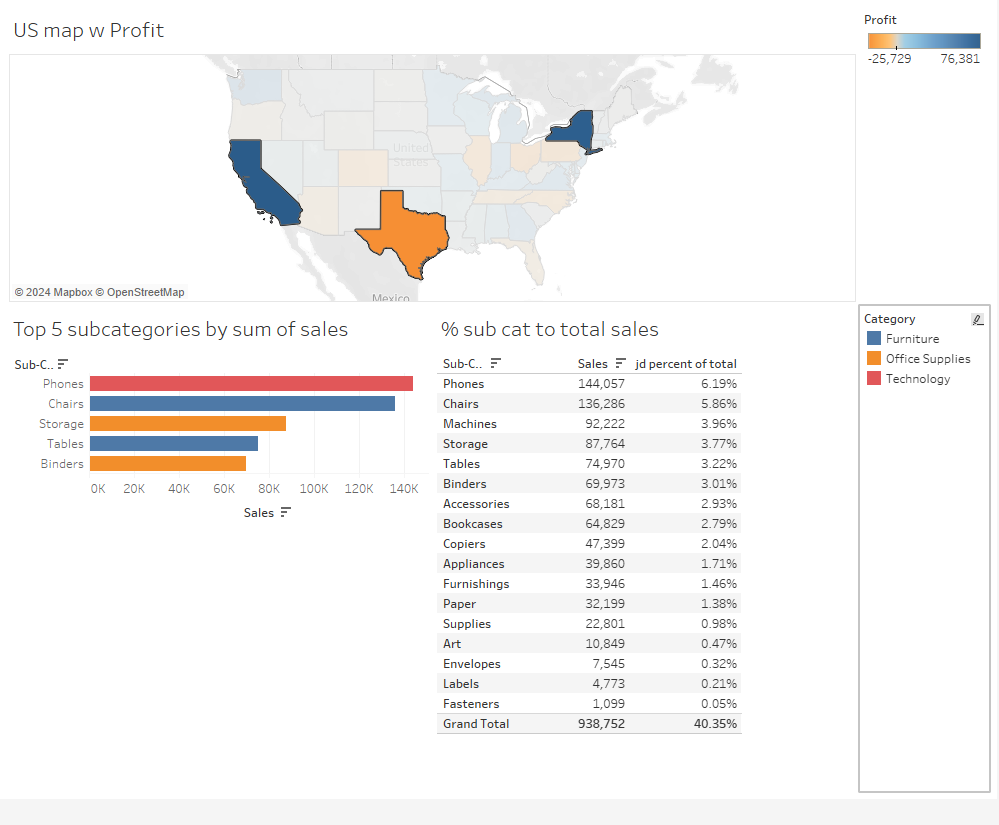
The Percent of Total is this
sum([Sales])/sum({ FIXED :SUM([Sales])})
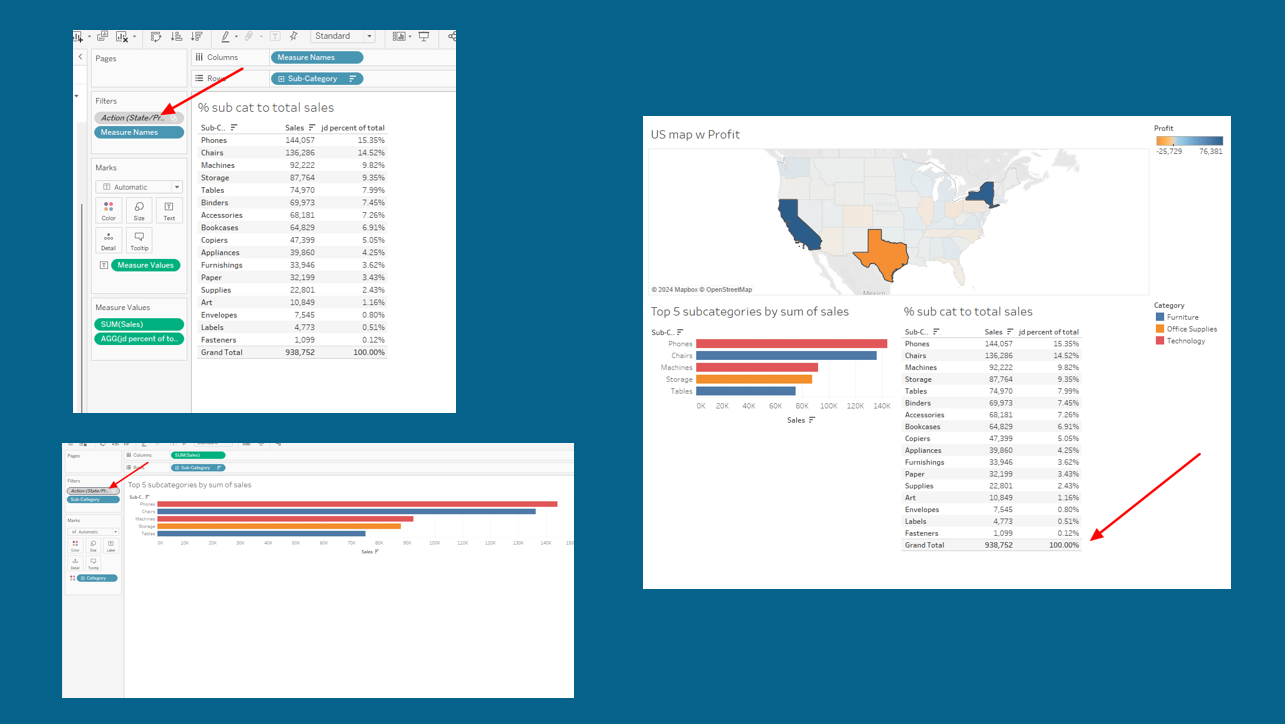
and it looks like the Percent is based on overall US sales – the Action Filter is applied after the LOD is calculated. Easy fix – Actions obey the Order of Operation (see – Link to Order of Operation) so here all that is needed is to place the Action Filter into Context on the Percent Of Total and Top N charts
7 Combining Actions
Now that you have seen how Actions are set up and used you can start building them into your own work – one final example of using combinations of Filter, Set, and Parameter Actions to get you started:
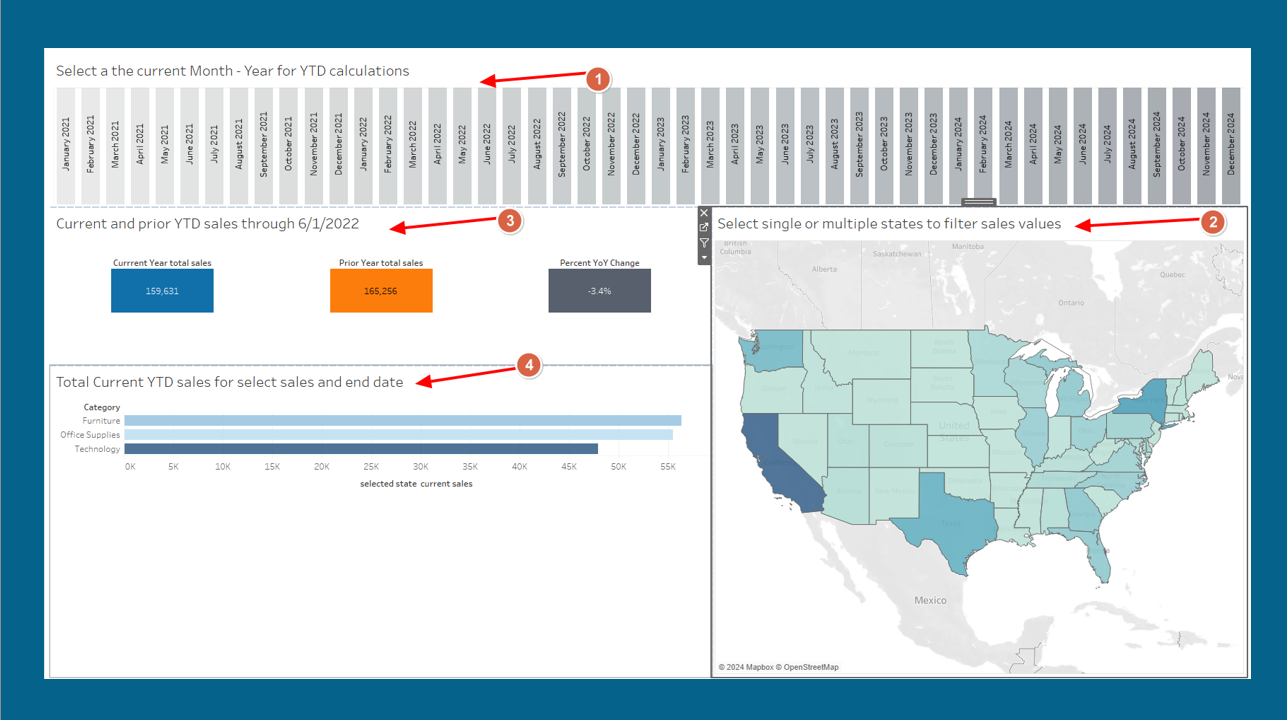
In the dashboard:
-
- A bar chart Date Value-Picker to select the end month/year for the Current periods
- A map Value-Picker to select single or multiple dates
- PoP YTD BANs driven by a Date Parameter and State Set
- Bar chart driven by a Date Parameter and State Set
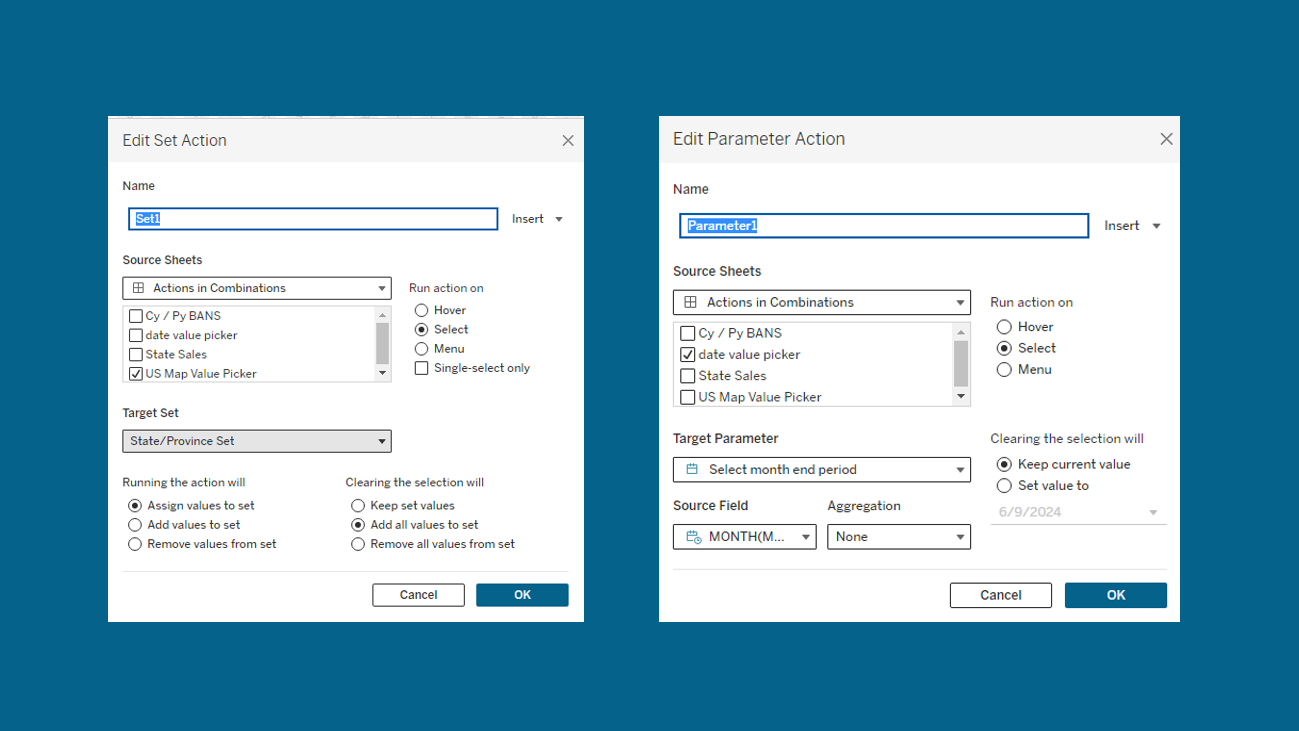
The Value-Pickers are used in parameter and set action passing values to the BAN and Bar charts
Selecting Washington, Oregon, California, and Nevada for the YTD ending May 2024 results in this:
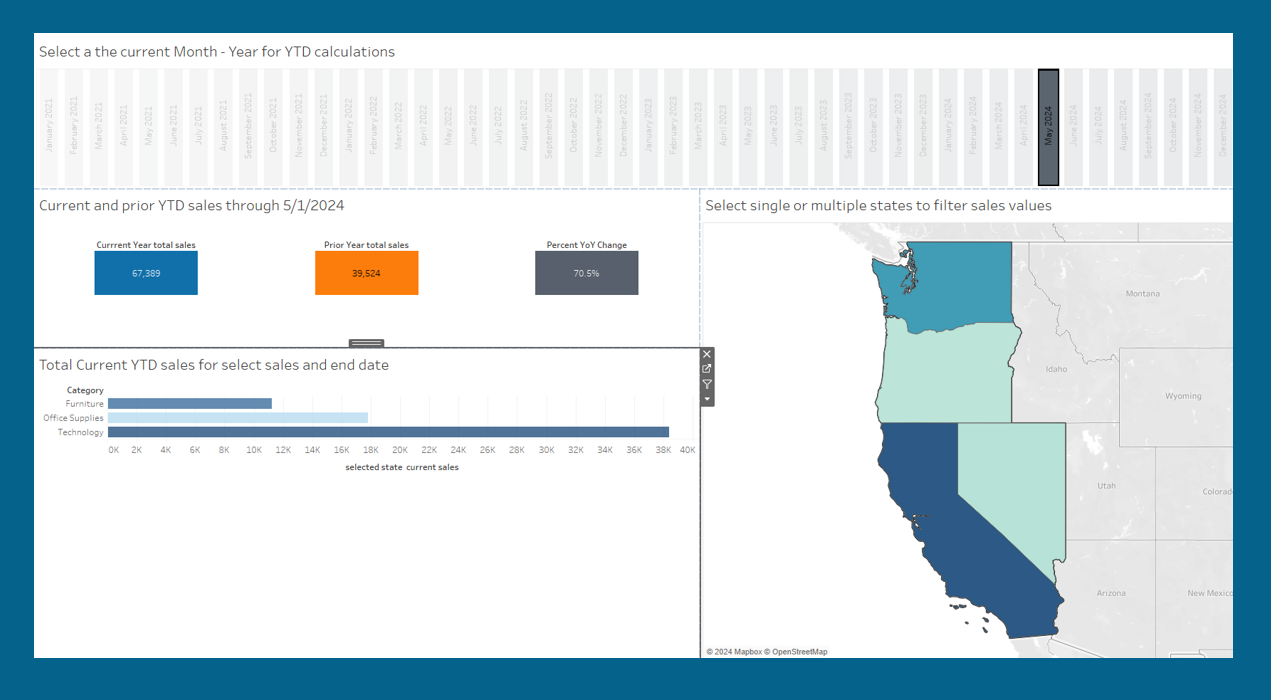
Done with just 2 Action –
The details for this and all other examples can be downloaded at Link to workbook
Now it is your turn to amaze your users. Show them what you can do on your next viz
Jim
