A frequent user question is how to find the Top N and then group and total all the remaining items into a single category "Other"
A common problem with many business applications – determining the Top N can be easily done in several ways. (Presented on VizConnect – see the recording at Link to Recording)
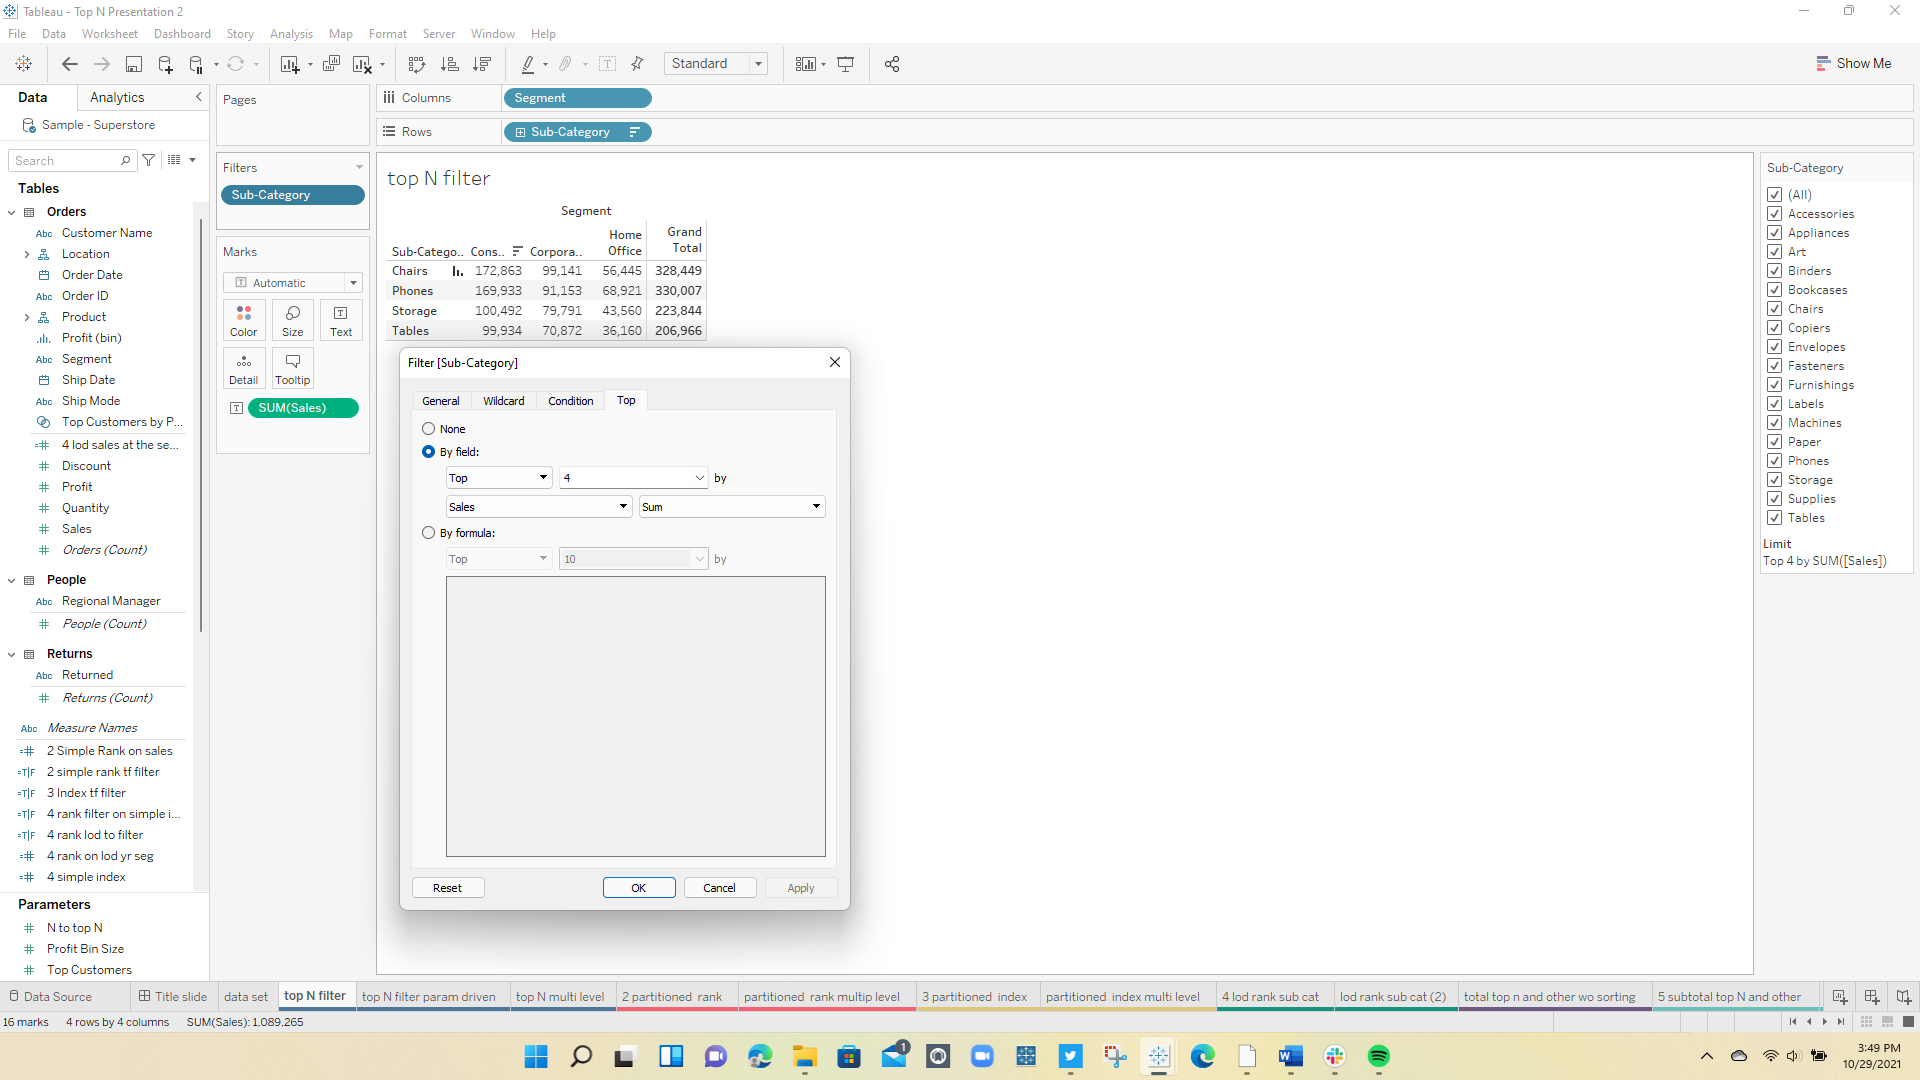
1 The Top N filter
Just apply a Top N filter to the dimension
A more typical question adds some complexity where the user wants to see the Top N across multiple dimensions which can be solved using Index() or Rank()


It works well but there is a need to pre-sort the data and when there are multiple dimensions you will need to determine which column to use in the sort:

3 The Rank solution
An alternative is to use a ranking based on either a measure or a LOD. All forms of Rank are table calculations and look something like this:
RANK_UNIQUE(sum([Sales]),'desc')
and each segment can be treated independently without presorting the data:

4 Top N and Other
Users often want to see the Top N individually and group the remaining as "Other". It requires a complex solution that combines both LOD's, Table Calculation, the use of Show/Hide filters, and a hack
Start with a LOD to find the Top N and "Other" based on sub category and region (Note I am using Include to support drilling down into the Region Hierarchy) :
{ INCLUDE [Region],[Category]:sum([Sales])}
and then Rank the LOD
rank(sum([6 lod sales region subcat]),'desc')
to start building a data table for the viz like this
for flexibility, I added a parameter to set the N level for the Top N and created this T/F calculation
[6 rank for lod sub reg]<=[N to top N]
and used this to add a Label to the "Other" group
if [6 rank tf ] then attr([Sub-Category]) else "Other" end
the data table now looks like this:
use a table calculation to total the "Other"
window_sum(if [6 subcat and other label]="Other" then sum([6 lod sales region subcat]) end)
and restart every Region places the Other Total on all subcategories, not in the Top N – after sorting the table now looks like this

Now the hack, we only want to see each of the Top N subcategories and 1 of the subcategories labeled "Other" in each region – That is done with a show hide filter:
if [6 rank for lod sub reg]<=[N to top N]+1 then "show" else "hide" end
After applying the filter and hiding the real subcategory labels the data table is complete

like a bar chart the results look like this
5 Drill down in Hierarchy
One advantage of using the Include LOD is that it supports drill into the hierarchy finding the Top N at subsequently lower levels

Hope this helps the next time you need to find the Top N and group the Other
The examples used here, and a few others, can be downloaded at workbook here
Enjoy
Jim


4 Responses
Jim,
great post, I love it.
How would you do a set based on a percentage? let me explain
I need to develop charts based on only the customers making the top80% of sales.
So I was thinking about doing a set (grouping customers ID) to apply as a filter in the subsequent charts, but dynamic sets are mainly based on topN which is not appropriate here, rank are table calc so not appropriate.
so how would you do that?
thanks
Loic
Thanks for the comment – if you are looking at identifying the customers that make up the percent of sales you will need to use a nested table calculations approach – there is an example of how it is done on my Tab Public site at https://public.tableau.com/app/profile/jim.dehner/viz/Publicversionsalesquintiles/Story1
Hi Jim,
Great stuff here. Really learned a lot putting this together. I have a question / have you seen this done before.
I would like to cut the data in the same format, but I would like to create a stacked bar as opposed to the bars at the sub-category level.
Do you have an idea on how we could do that?
Since a lot of the work depends on the table formulas, I am unable to make this happen.
Would love to hear your thoughts !
– Blake
Thanks for the comment – ranking in any of its forms requires record to record comparison – as for your specific question on stacked bars I recommend post it on the Tableau Community Forums and include a workbook showing wht you have done and what you wna to accomplish – you will have access to the wide variety of talent there