
Include and Exclude – the other 2 LODs – How often do you use them? If you are like most, less than 20% of the time.
So what do they do and when do you use them? – confused? me too!
Here we will focus on how to use the Include and Exclude forms of LOD's –
They are calculated in Step 7 of the order of operations – long after the structure of the data table has been set in steps 3-5 and well before Table Calculations are performed in Step 10
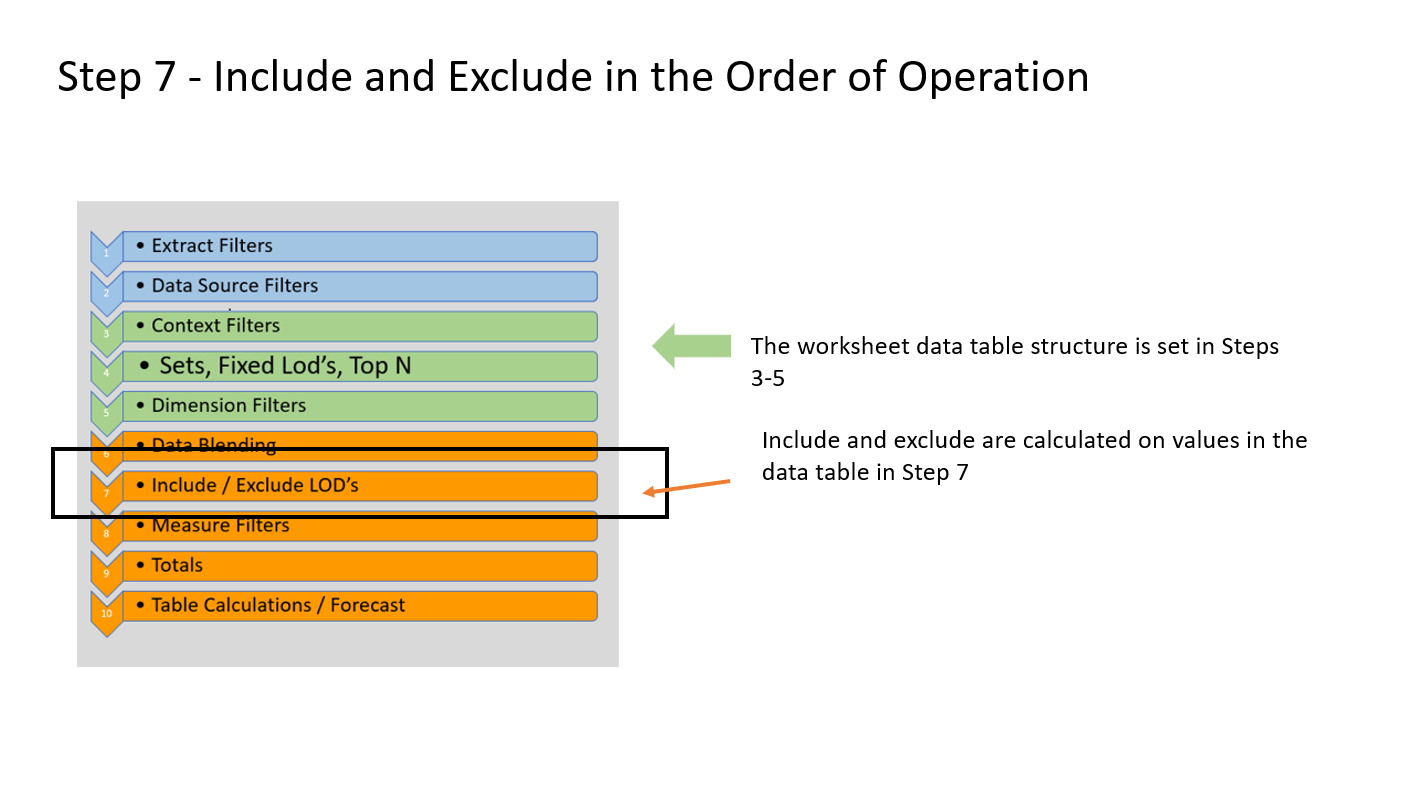
They use the values that are in the underlying data table for the worksheet and Include or Exclude refers to the relationship between what you see on the viz (the summary table) and the detailed underlying data.
"Include" creates calculations that are affected by dimensions (and values) that you don't see in the viz to the calculation.
"Exclude" calculations return totals that disregard a dimension that is visible in the view.
OK – sorry about that – now let's focus on examples that will clarify what is going on.
Syntax
Start with a keyword – Include or Exclude – followed by a dimension list separated by commas and then an expression to aggregate the records from the detailed data table
{Include [dimension lists]: agg(measure)}
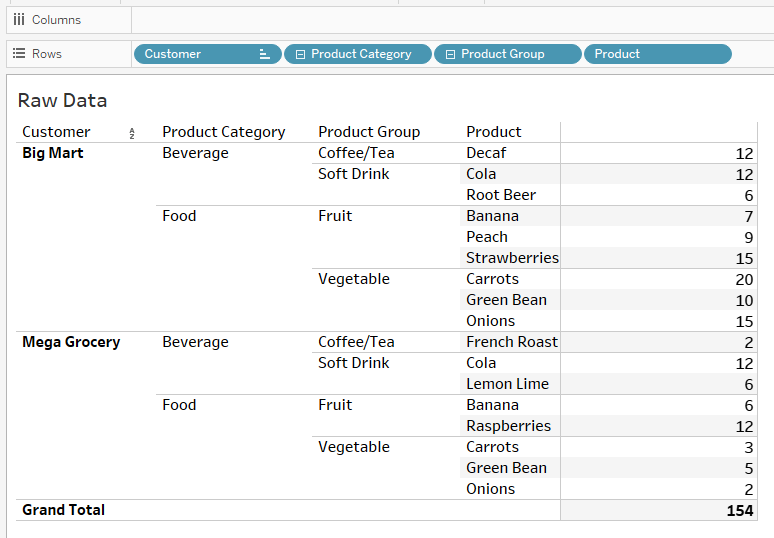
Data set
I'll use this small data set for all the examples –
Example 1 – Include v Fixed
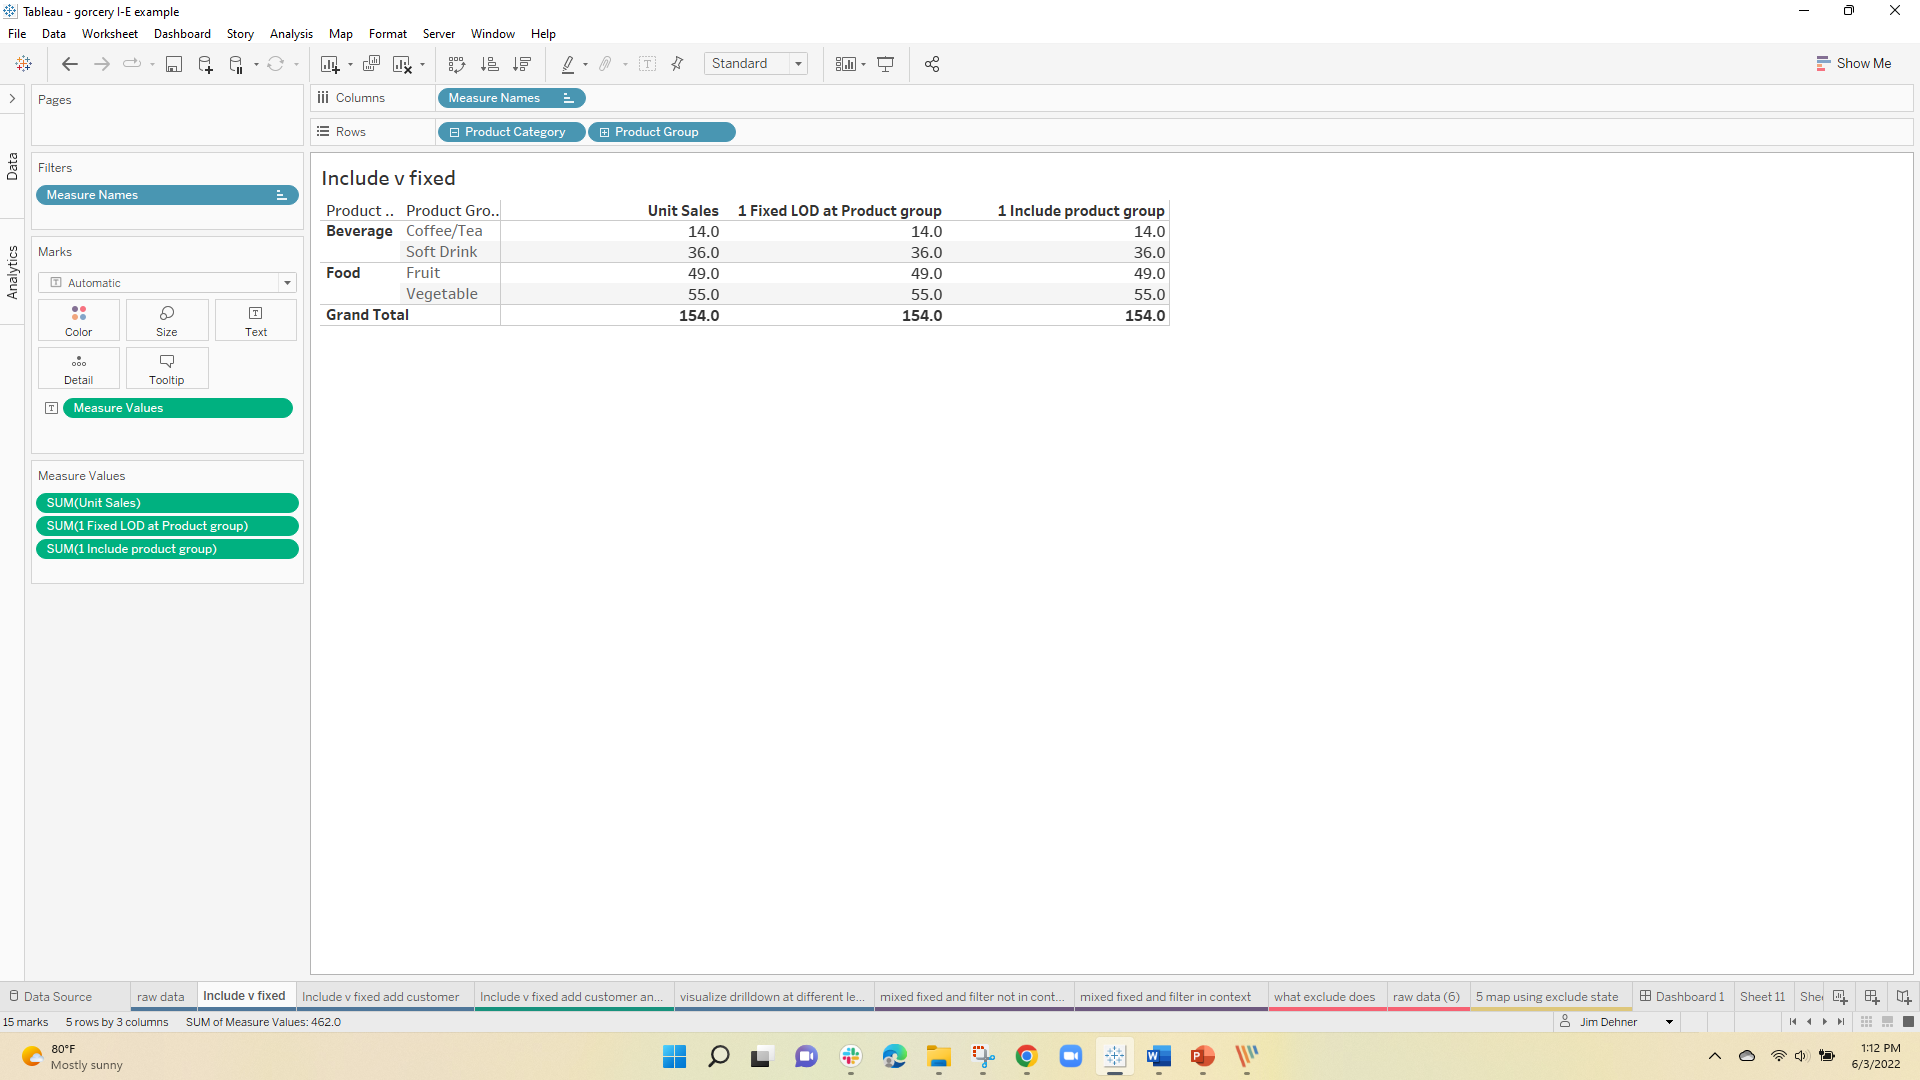
We'll start by looking at how Include compares to Fixed (each at the Product Group level) – First using sum() as the aggregation:
{ FIXED [Product Group]:sum([Unit Sales])}
and
{ Include [Product Group]:sum([Unit Sales])}
At the detail level, the Fixed formula returns values, as expected, that are constant at the product group level
On the other hand, the results from Include match the simple Sum() aggregation –

When the product hierarchy is compressed first to the Product Group level – the Fixed calculation returns constant values and the Include returns values equal to the simple sum()
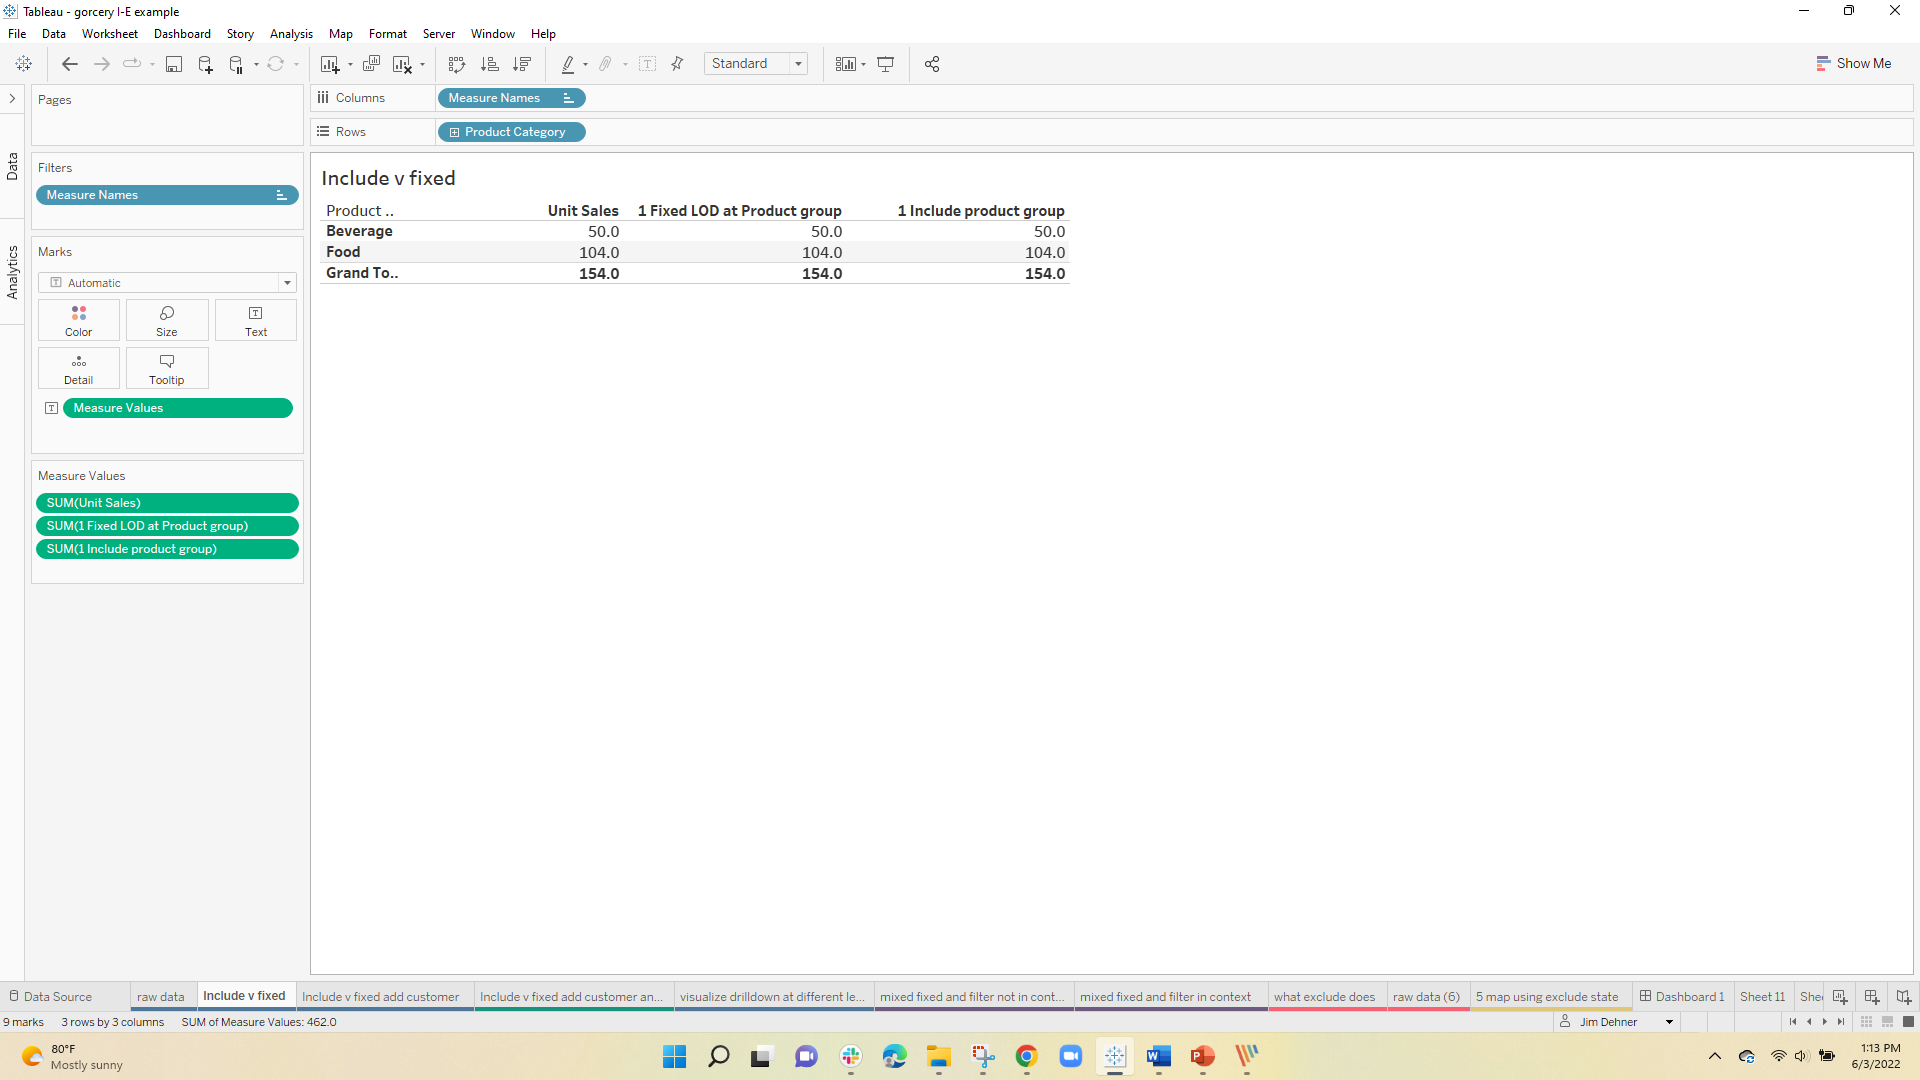
And finally, when compressed to the Product Category all 3 calculations now return the same values –
So if Include returns the same values as a simple sum() then when would you ever use it –
The difference can be seen when aggregating with AVG() – to illustrate I have added the simple record count, and the count of the Product Groups:
{ FIXED [Product Group]:COUNTD([Product Group])}
and this is the Include
{ Include [Product Group]:(COUNTD([Product Group]))}
Now we see the difference:
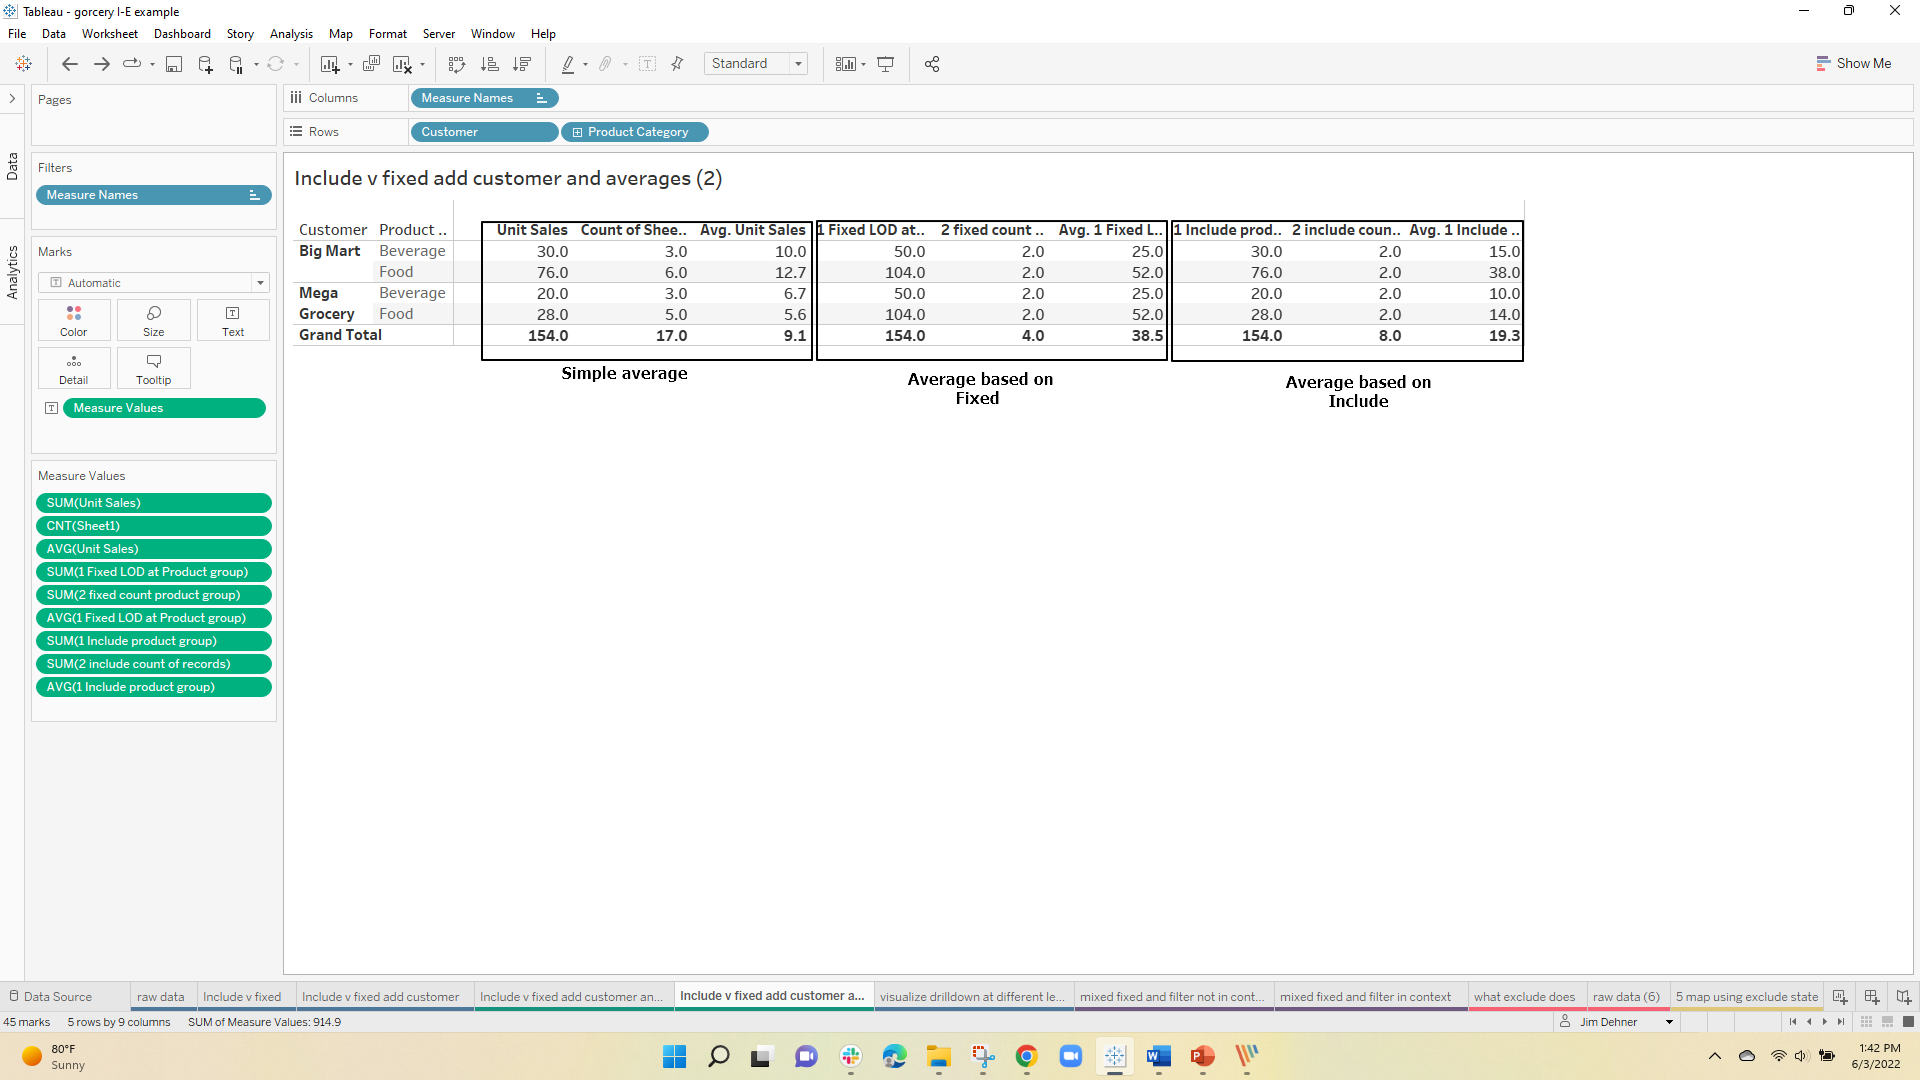
The simple average is based on the total record count. So for the 30 unit beverage sales for Big Mart, there were 3 detailed records and the average was 10.
The Fixed average is based on the Fixed total of 50 for all beverages divided by the 2 distinct beverage values or 25. and finally the Include average of the 30 total Big Mart Beverage units divided by the 2 unique types for 15.
OK, so there is a difference but from a practical sense when would you use Include
Example 2 – Include drill down
Often a Product Manager would like to see the average sales for a group of products without including the color or flavor – or may just want to see the overall average for a customer without considering the detail –
In those cases Includes allows the PM to set the level for the base (denominator) calculation –
Using the same data set and Include at the product group level – the PM can look at the detailed product level and see:
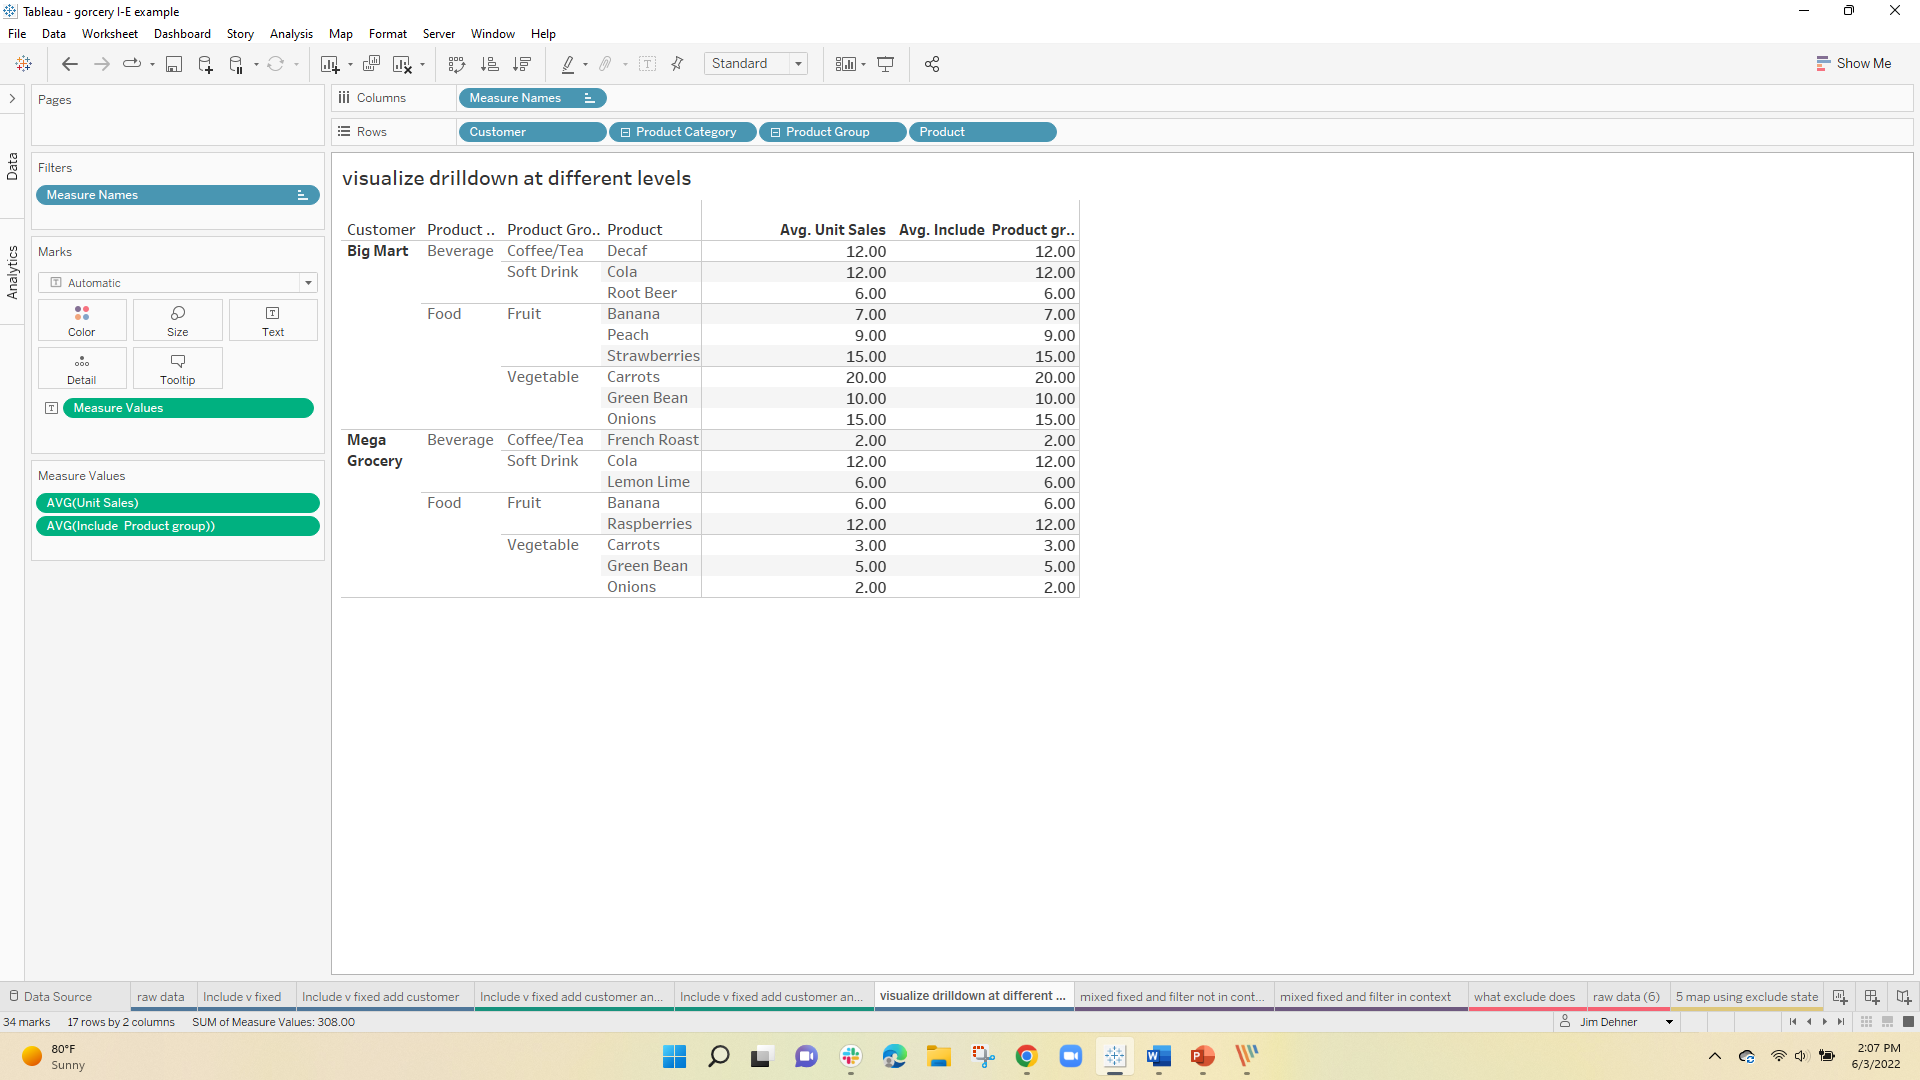
at the product group level, the base for the average is now 2 – there are 2 distinct Product Groups "Coffee/Tea" and "Soft Drinks" :
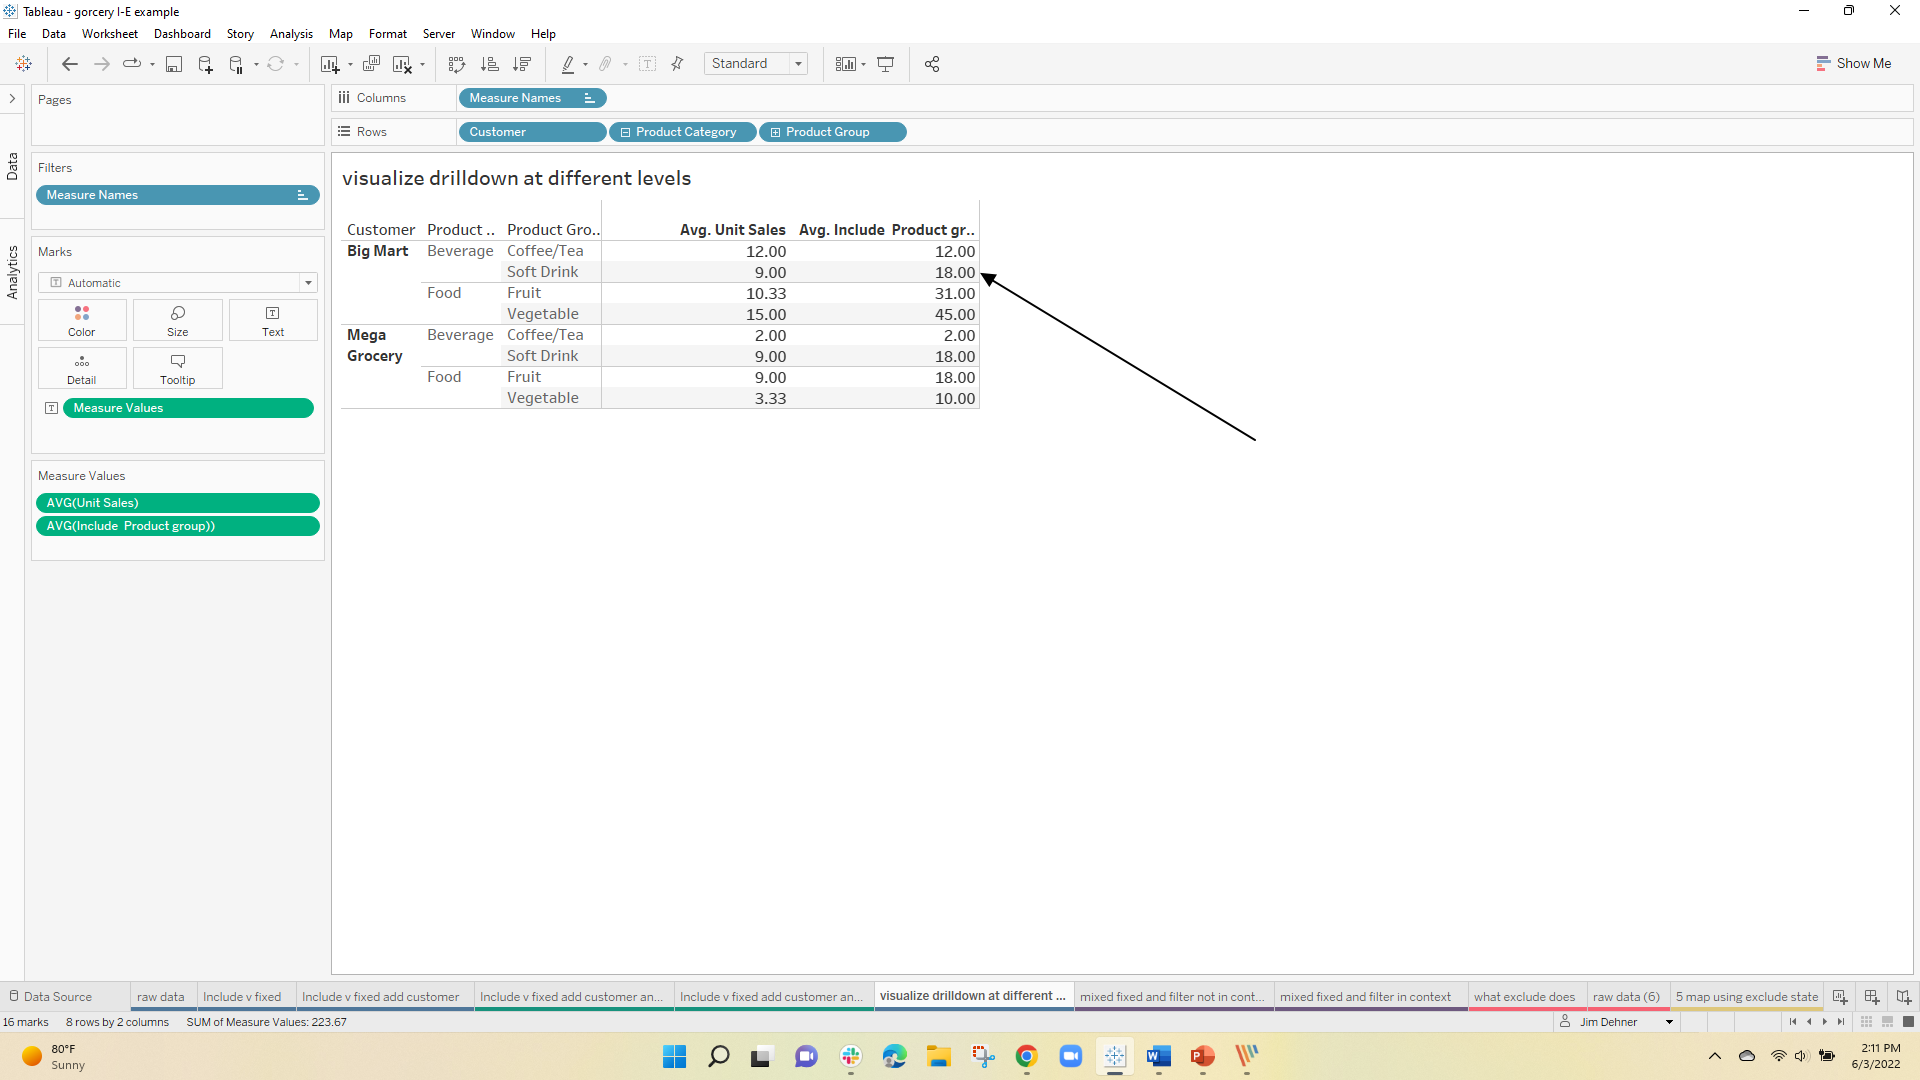
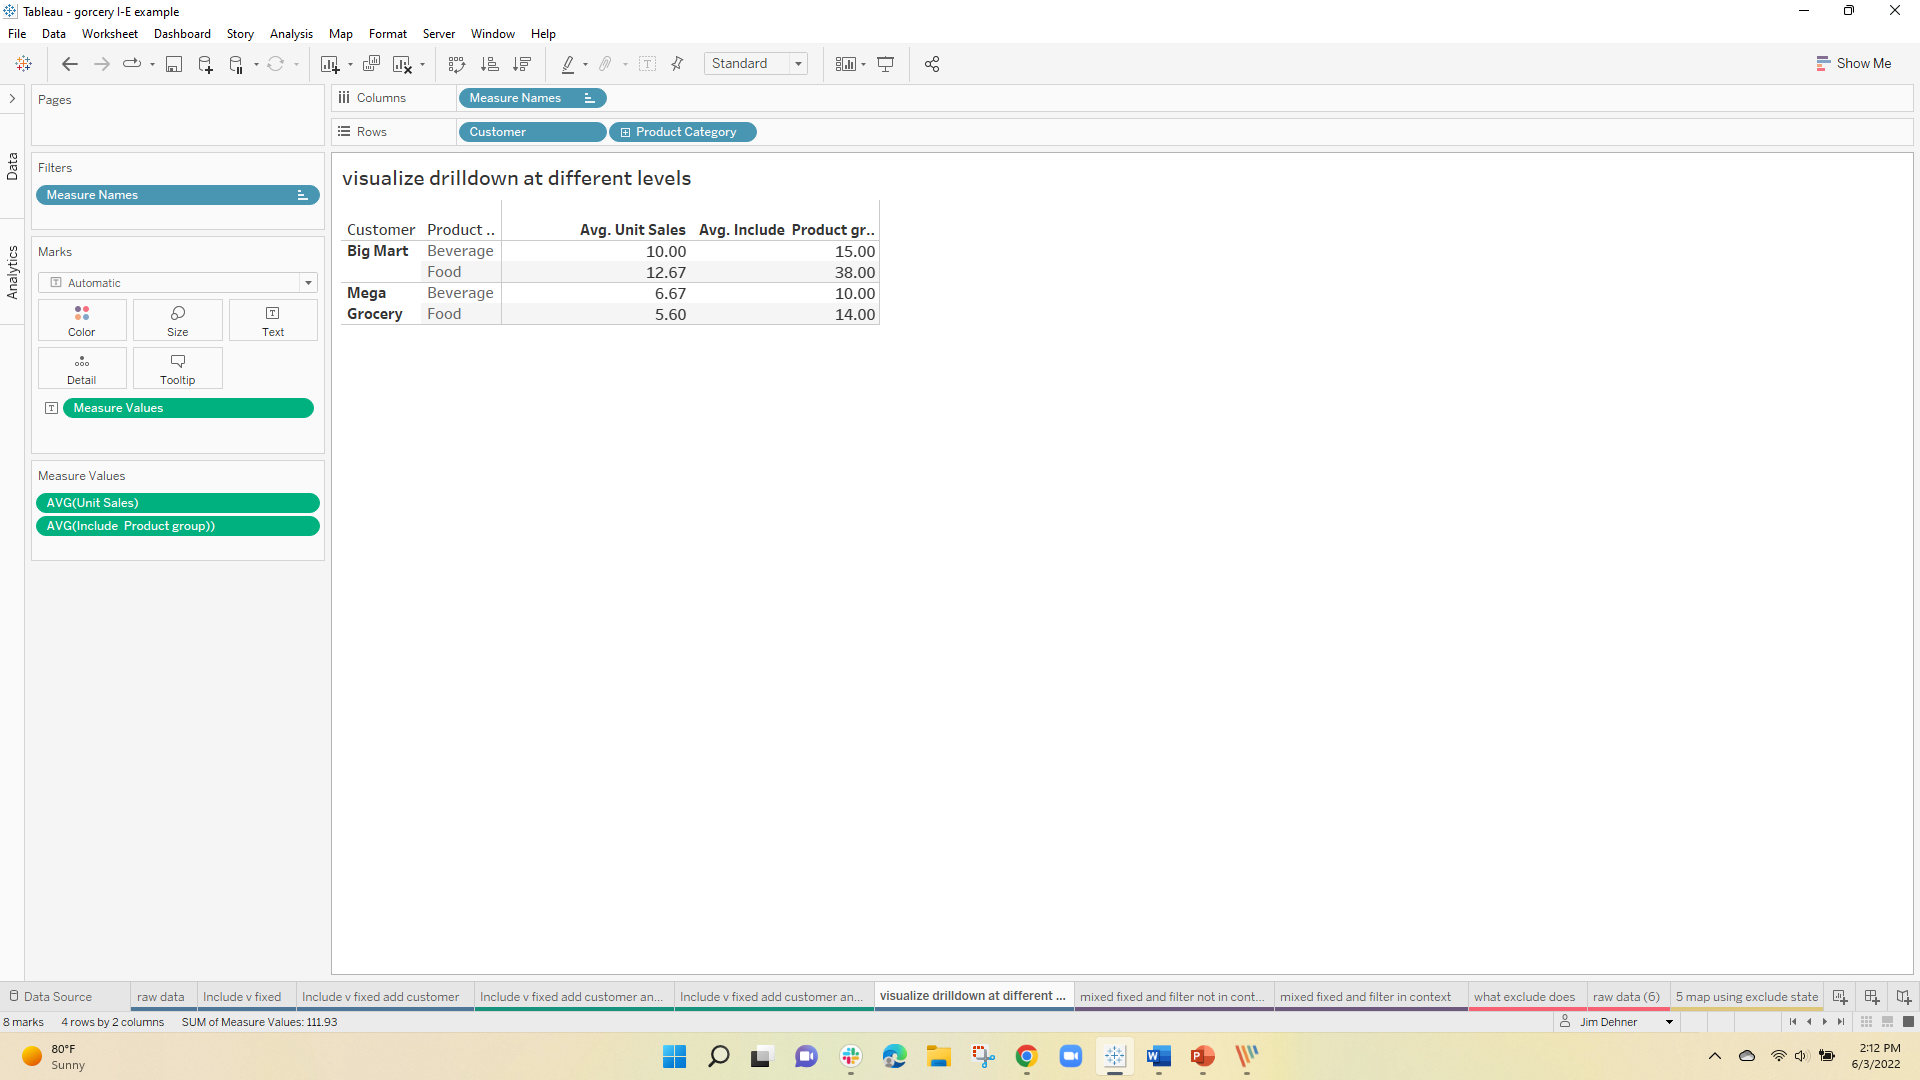
and at the Customer level, the total for Beverage (30) is divided by the 2 unique Product Groups for an average of 15
Example 3 – Apply a filter to one calculation but not to another
A frequent question is how to filter a dimension in one calculation but not apply it to another in the same worksheet.
Typically users attempt, without success, to use the Context filter to apply or not apply the filter.
The solution is to use a combination of a Fixed calculation and an Include – but do NOT place the dimension in Context – apply it as a Dimension filter.
When not in context the Fixed expression is evaluated before the filter is applied – the Include calculation is evaluated after all filtering has been applied so is affected by the Dimension filter.
With the same data set and using an Include and a Fixed statement at the Product Group level, the percent to total can be calculated as
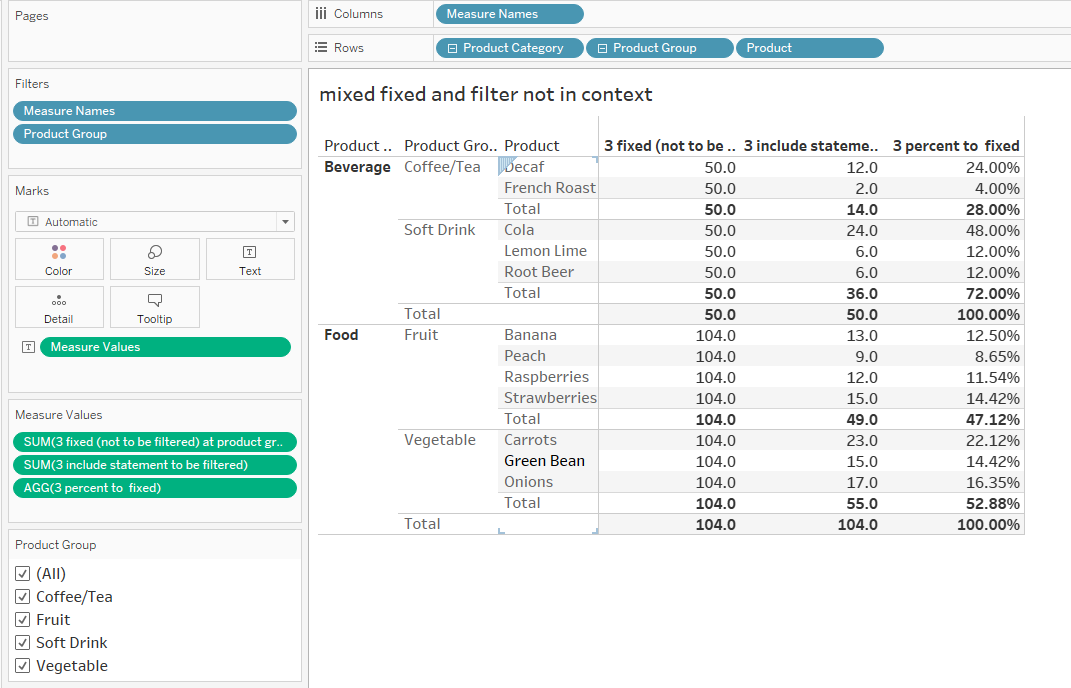
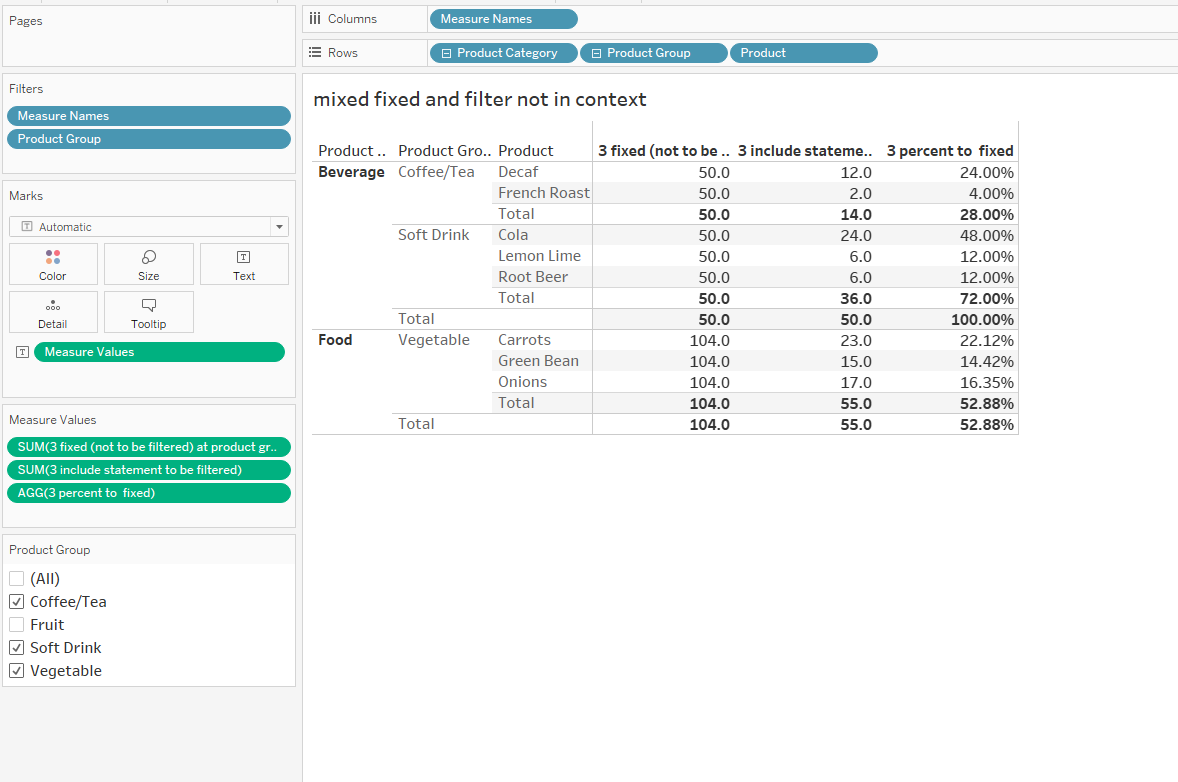
Note that Product Group is NOT in Context so filtering out the Fruit will not affect the LOD expression but will affect the viz and the Include expression :
Example 4 – Replace Multi-level Fixed
I often use Fixed LOD's to create a layer in the data set that combines several dimensions yet can still be used in any other calculation –
This will take all the combinations of Product, Product Group, and Product category and returns the sums the total unit sales for each – That total can be used in any other type of calculation
{ FIXED [Product Category],[Product Group],[Product]:sum([Unit Sales])}
Include can be used the same way and eliminates the need to explicitly list each of the dimensions –
This will return the same values as the Fixed expression above at all levels of the drill-down
{ INCLUDE [Product Category]:sum([Unit Sales])}
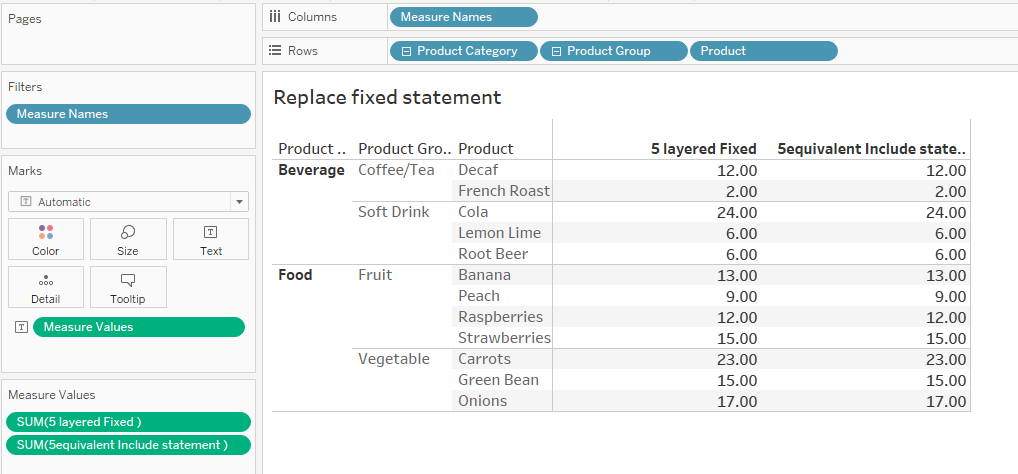
As noted earlier, you will need to be careful how the expression is aggregated – That said, it can be a cleaner, more elegant, way to look at multi-level comparisons in the data.
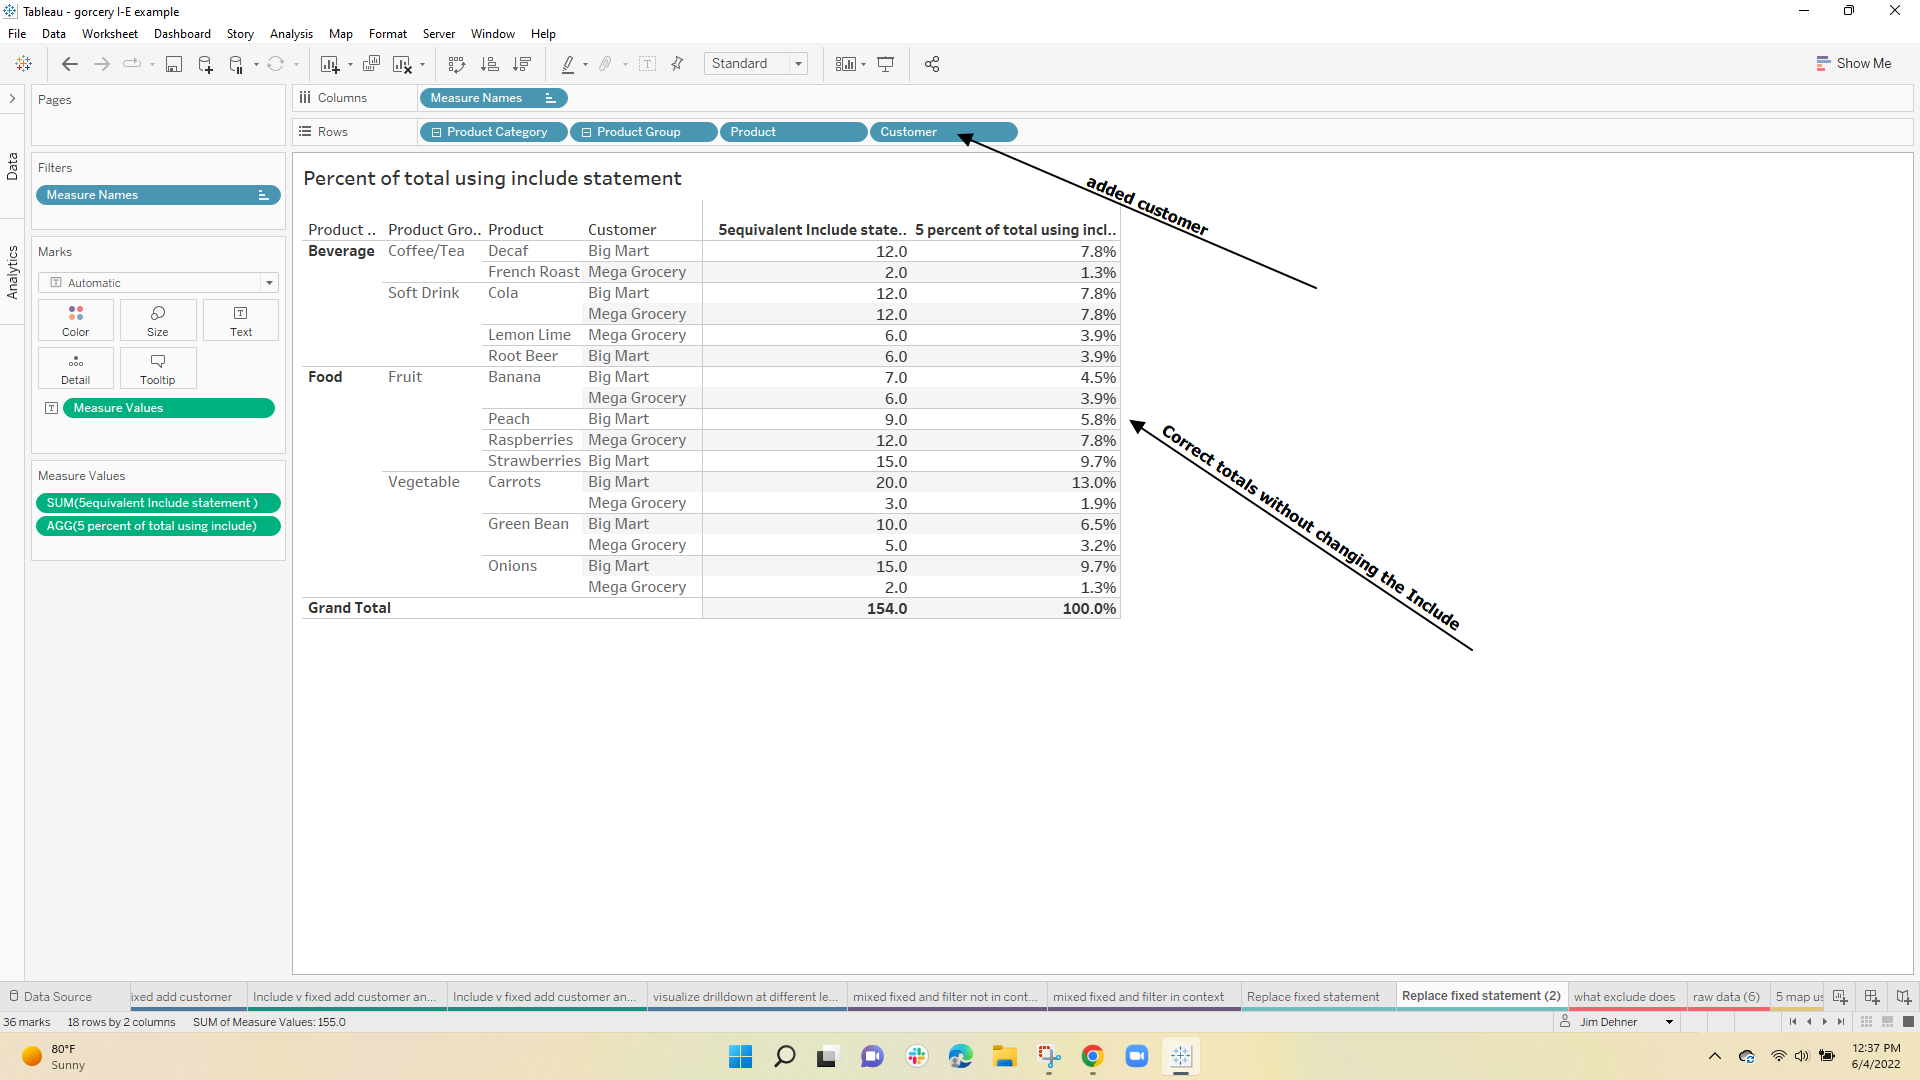
A single expression
sum([5equivalent Include statement ])/sum({ FIXED :sum([Unit Sales])})
will allow the user to drill up or down the hierarchy returning the correct percent of the total at each level –
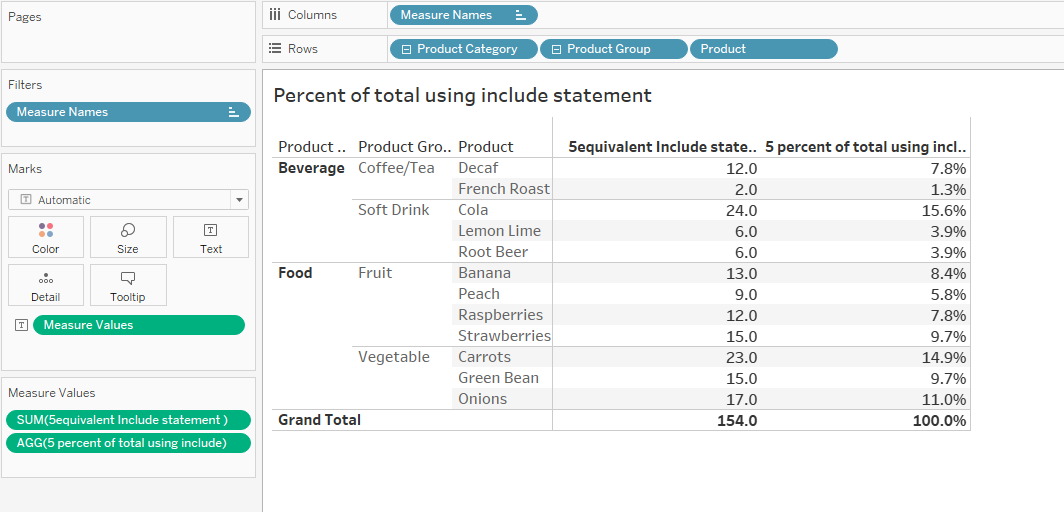
Additional levels can be added to the hierarchy by adding the dimension to the viz without changing the Include statement
Example 5 – Exclude
Exclude is seldom used. It returns a result that does not consider a dimension that is visible in the view. The example I use most often uses Superstore data and calculates the state-level sales and region-level sales in the same view.
The statement will not consider the Dimension "State" and will return the total sales at the next higher level in the view (in this case region)
{ EXCLUDE [State]:sum([Sales])}
This just returns the percent of the state to the region's total
sum([Sales])/sum([5 exclude state ])

Hope this helps you understand how to use Include and Exclude – they take some practice so try to work them into your future viz
Download the Tableau workbook at Download Workbook
Enjoy
Jim

One Response
Well done and at last– a bit of light shed on what can be confounding, at best. One more reason to bookmark the Dehner blogs!