
Do you use sets? If not why not?
Sets are not like Groups or Filters:
Sets categorize your entire data set into 2 segments – Records are either "In" or "Out" based on the value of a single dimension. All the data in the data table and available for use in any type of calculation – The Set will return a True when records are "In" the set or "False" when they are not.
Filters, on the other hand, eliminate data from the worksheet data table. The detailed data is no longer available for calculations and, while that is the goal in some cases, comparisons to the overall data set are no longer possible.
Groups are used to categorize data into a hierarchy based on the values of a single dimension. There can be multiple groups based on collections of values but groups are limited to a single level.
So where would you use a set –
1 – Proportional Brushing
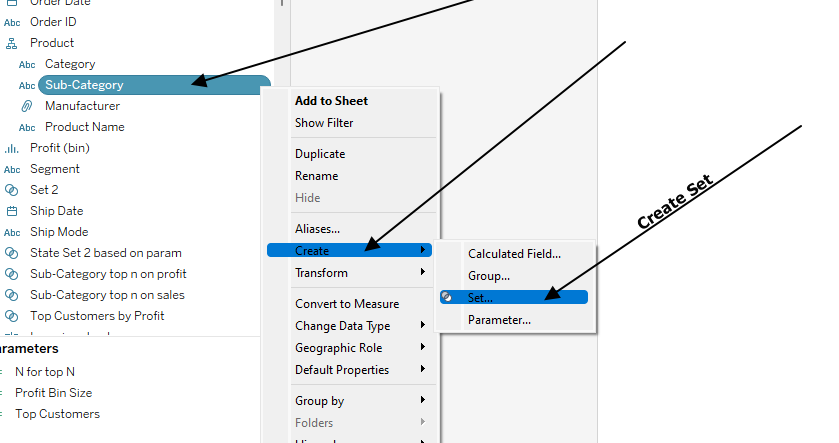
Comparing a part (the "In") to the whole is typically referred to as proportional brushing. Sets are based on the values of a single dimension – Creating one is easy – just select a dimension, then Create, and Set –
Then on the General tab just select the values you want "In" the set
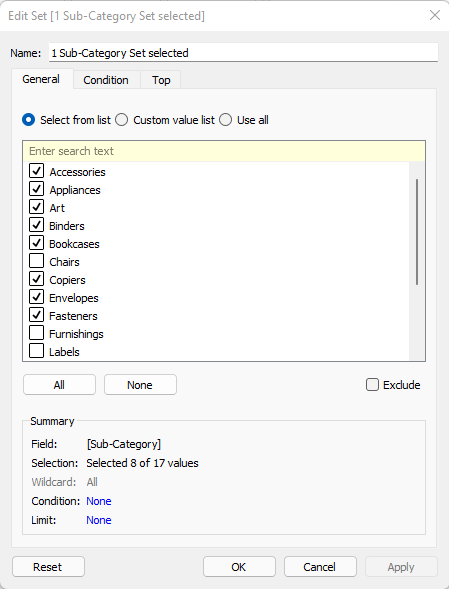
Congratulations! you've created your first set –
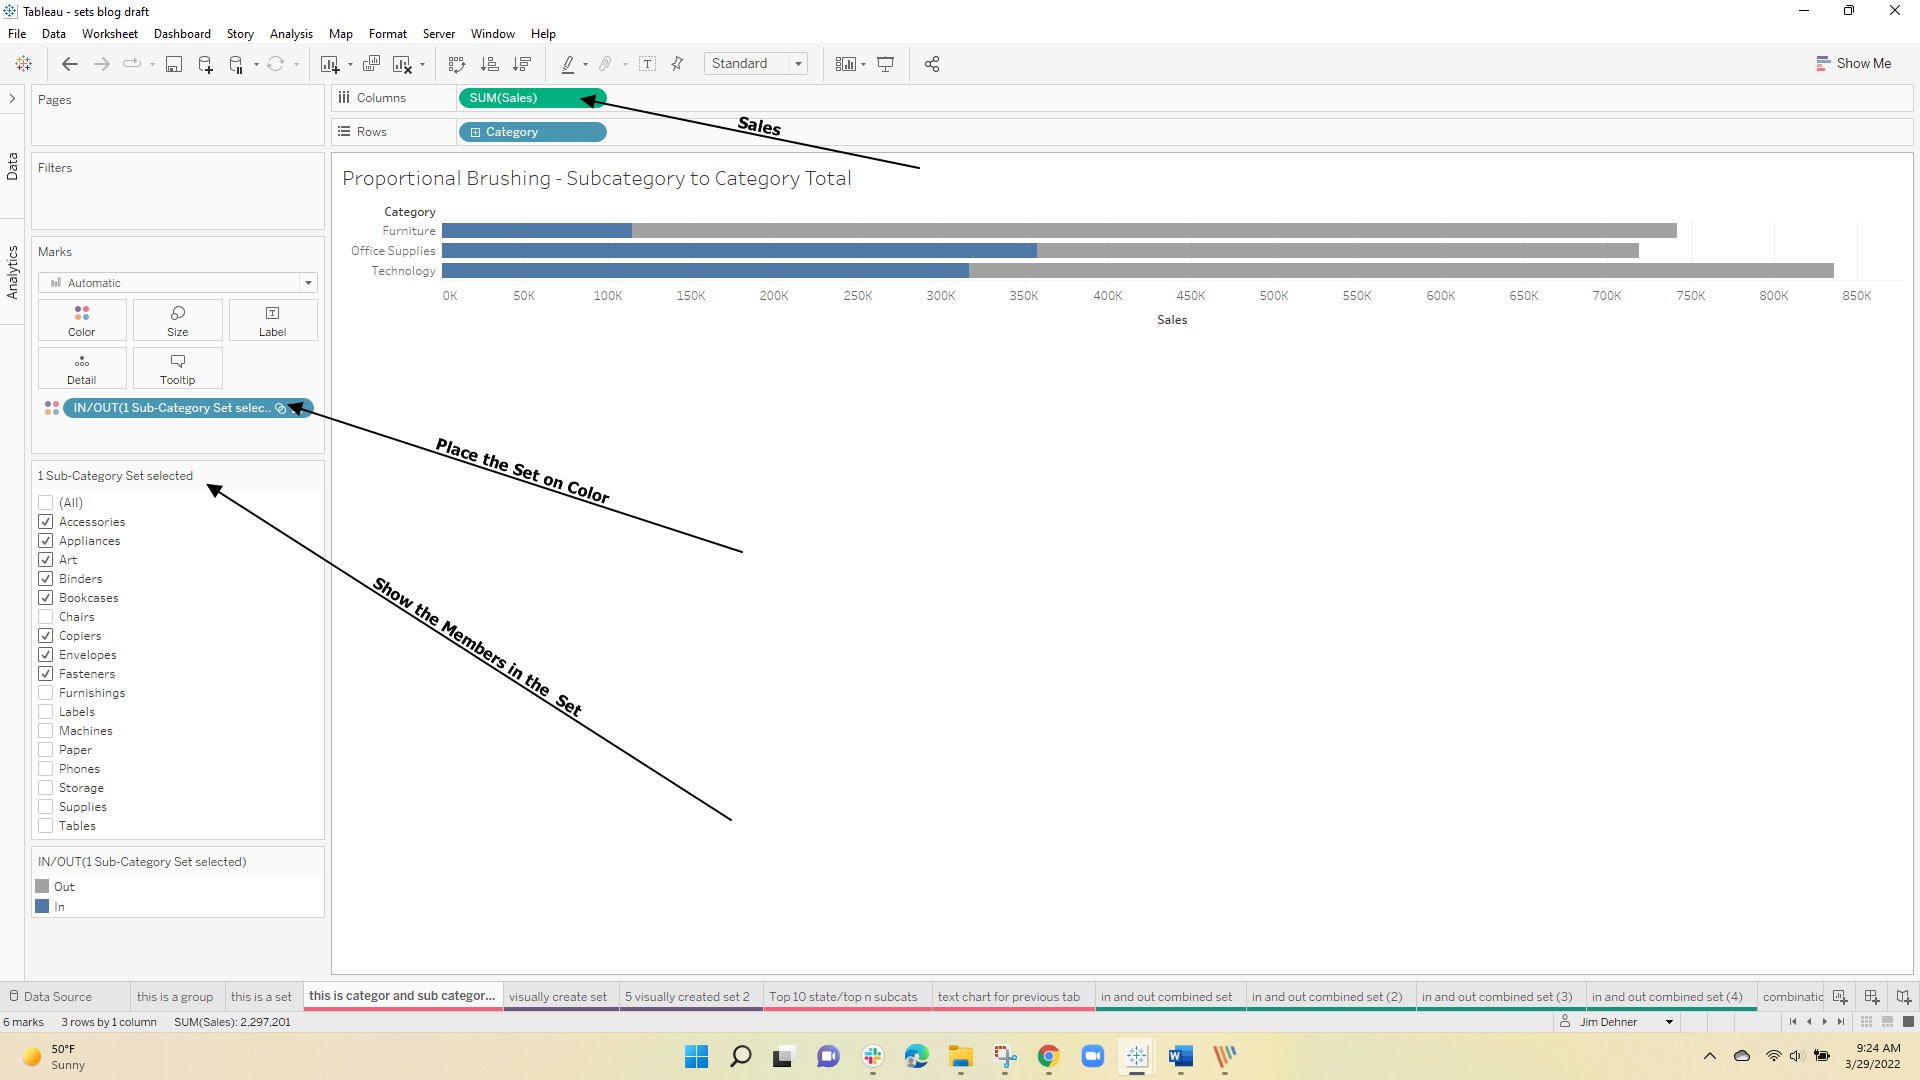
Now to use it in a proportional brushing viz place Sales on Columns, Category on Rows, and Show the Members in the Set – there you can manually select the "In" set
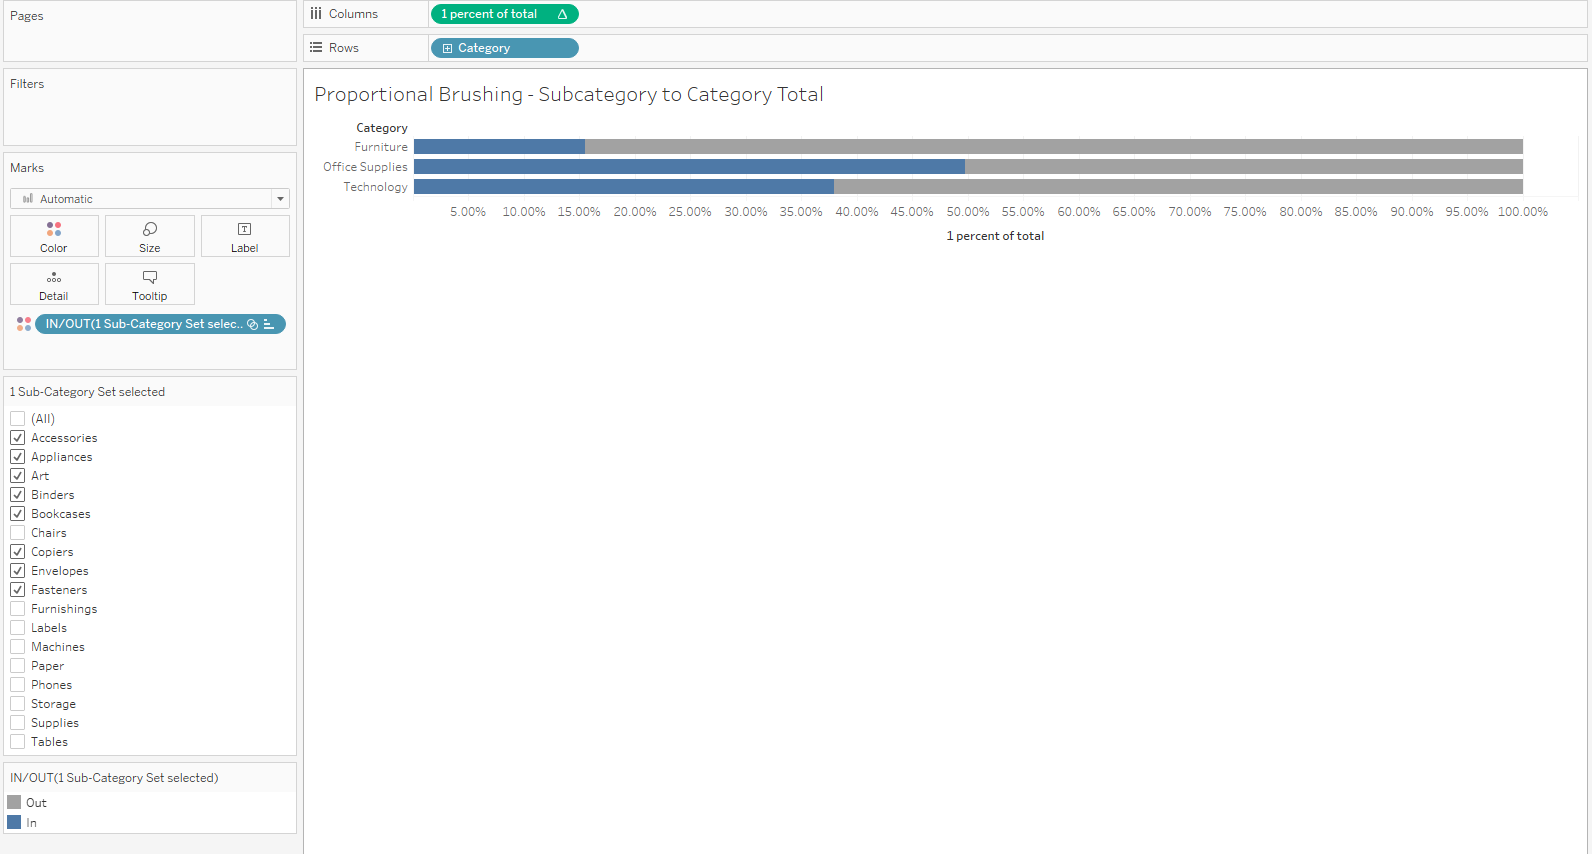
The results can be displayed in units or as a percent to total using a quick table calculation
2 – Dynamic sets – Top N
But what if you need a set that is based on the Top N of sales and it needs to be dynamic.
Take advantage of the Top Tab when you create the set – here based on the sum of sales
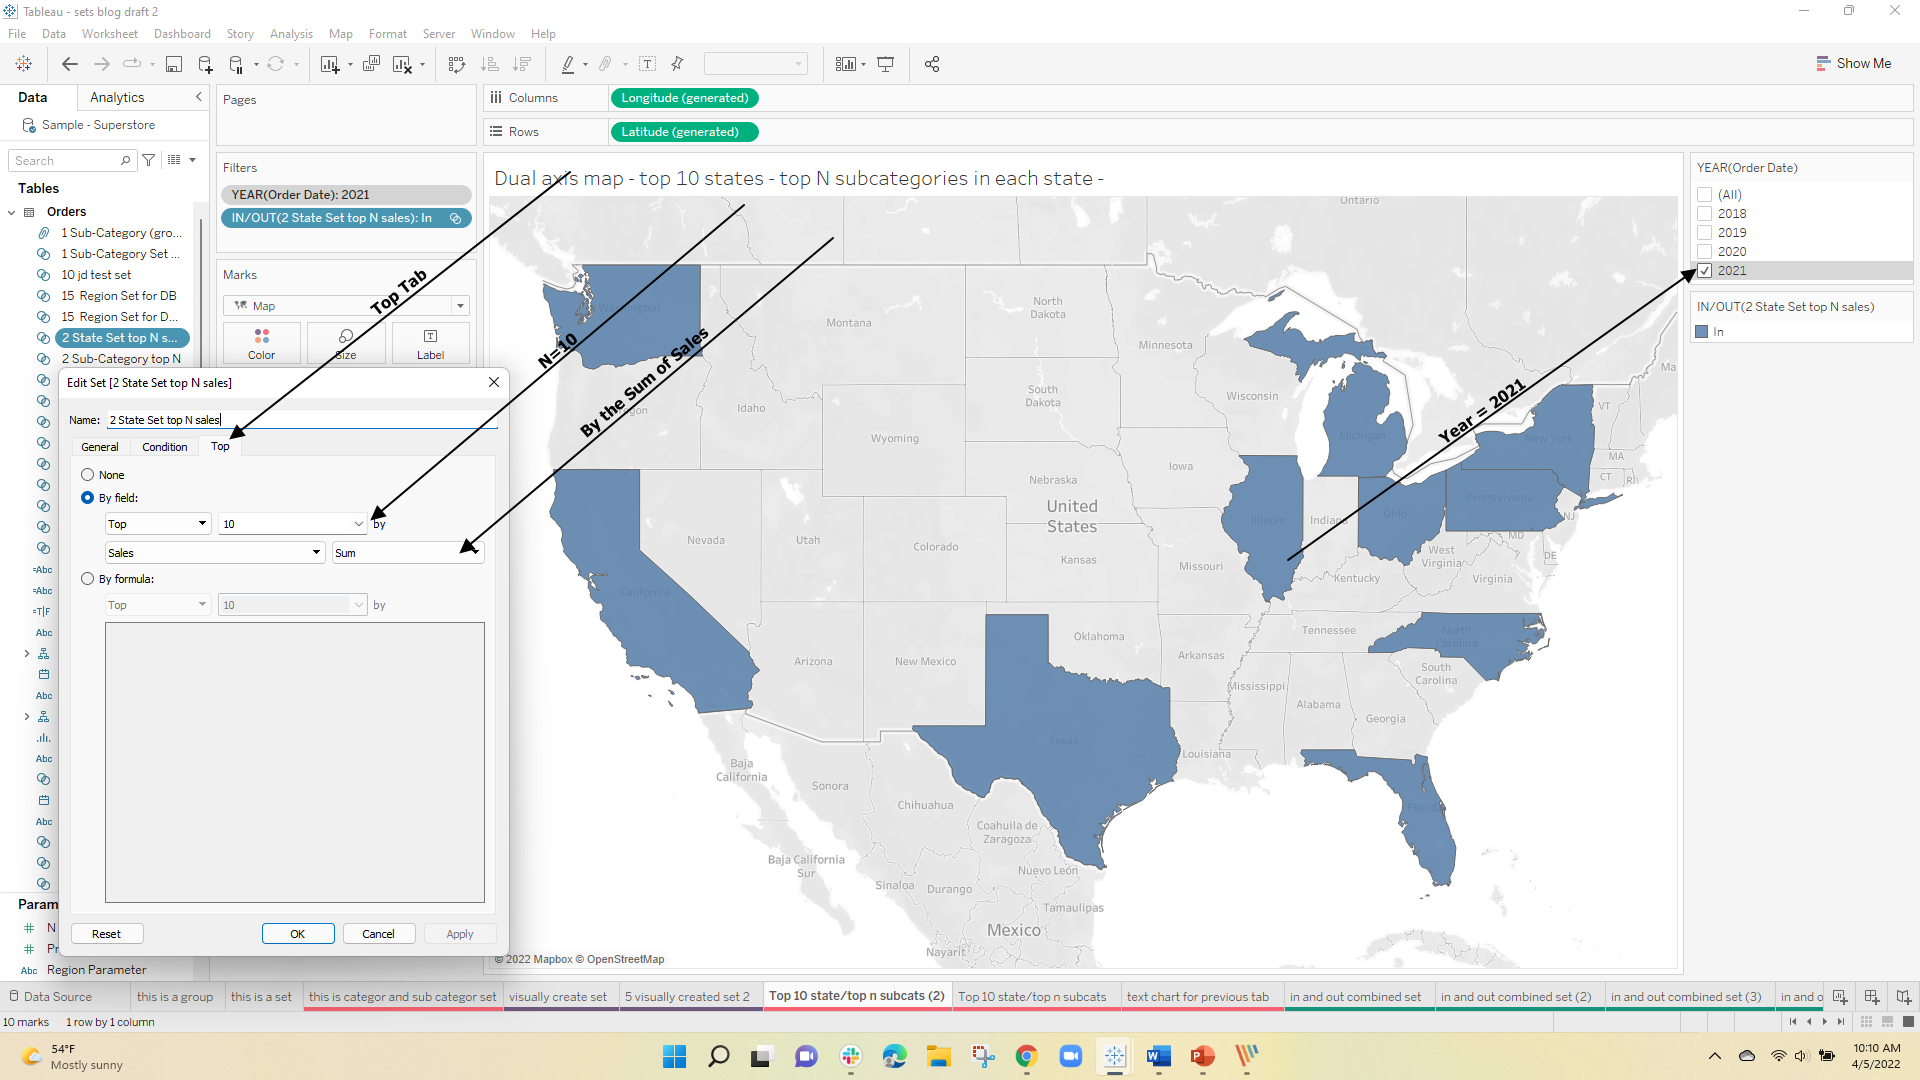
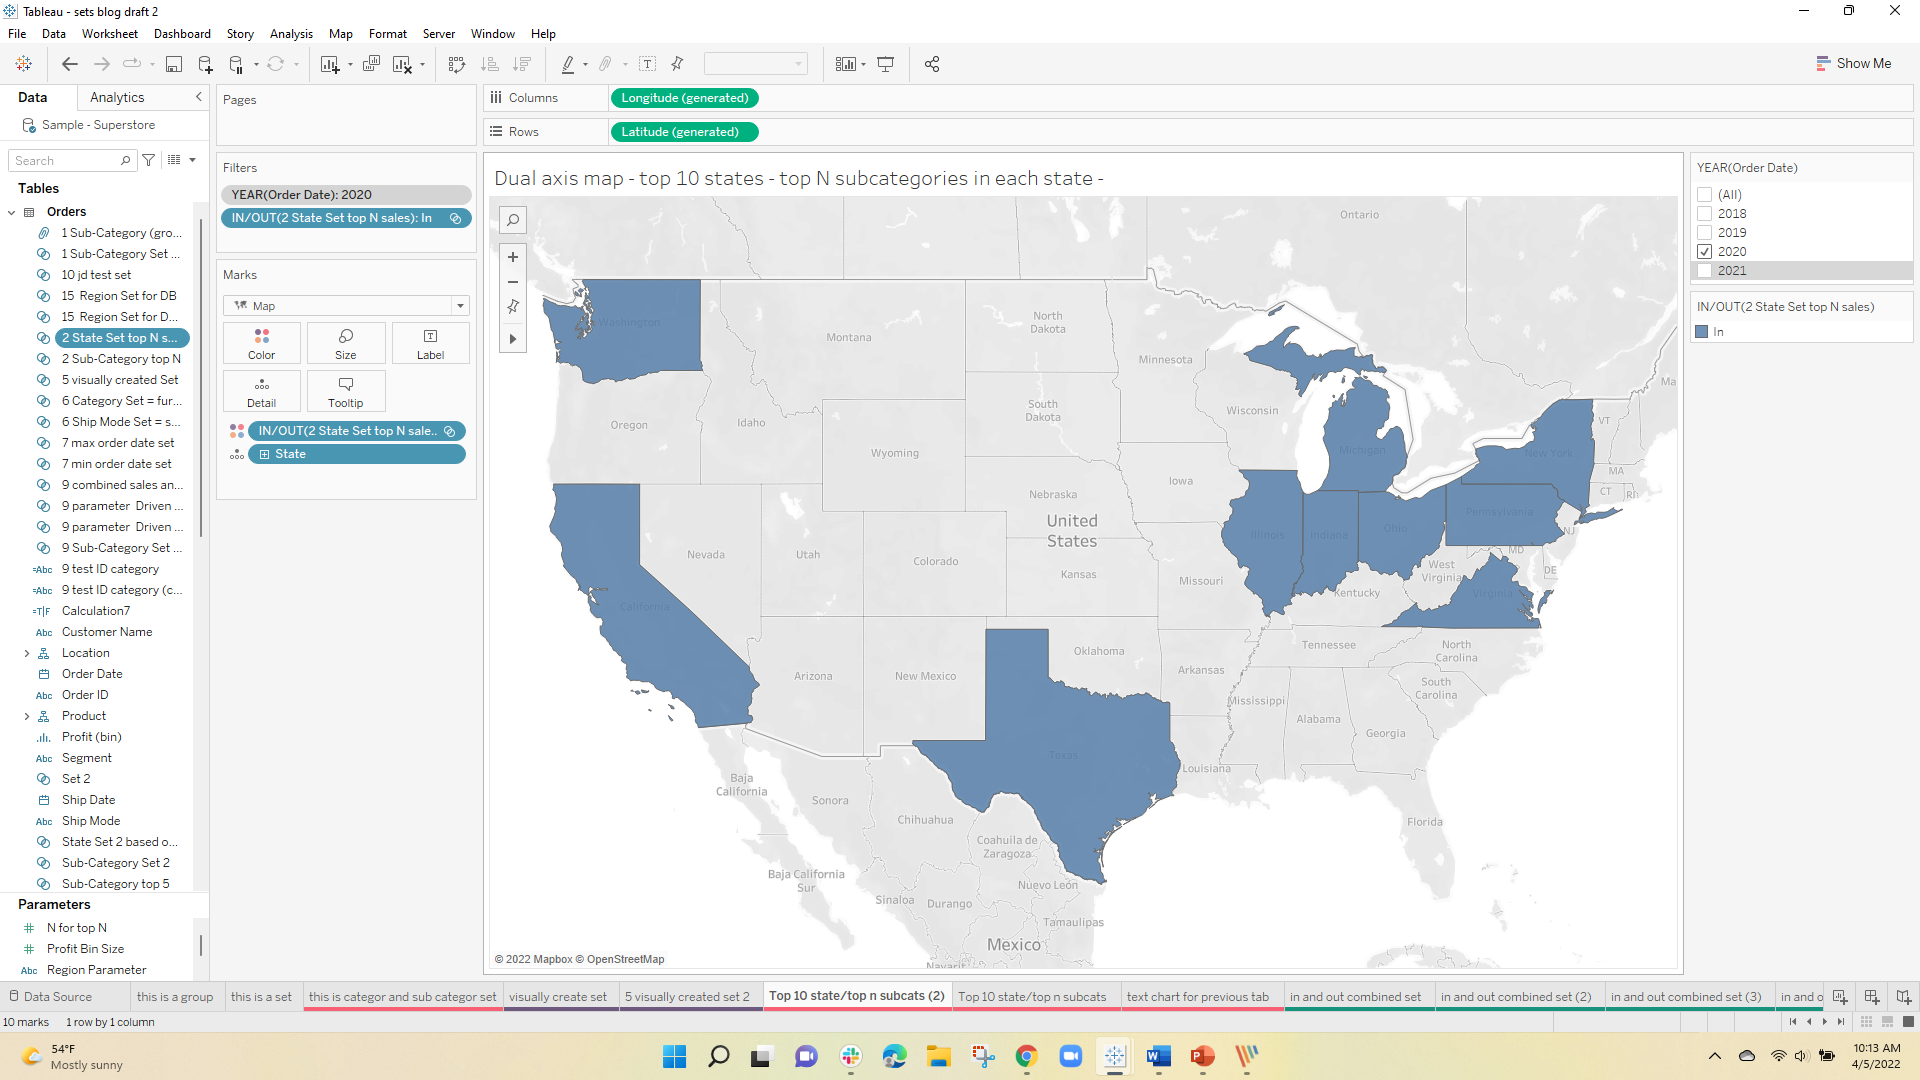
Note also that the year is placed in Context (context filters are applied before the Top N are determined). When the year is changed from 2021 to 2020 – Florida is replaced by Indiana in the Top 10 dynamically.
3 Sets based on a Condition
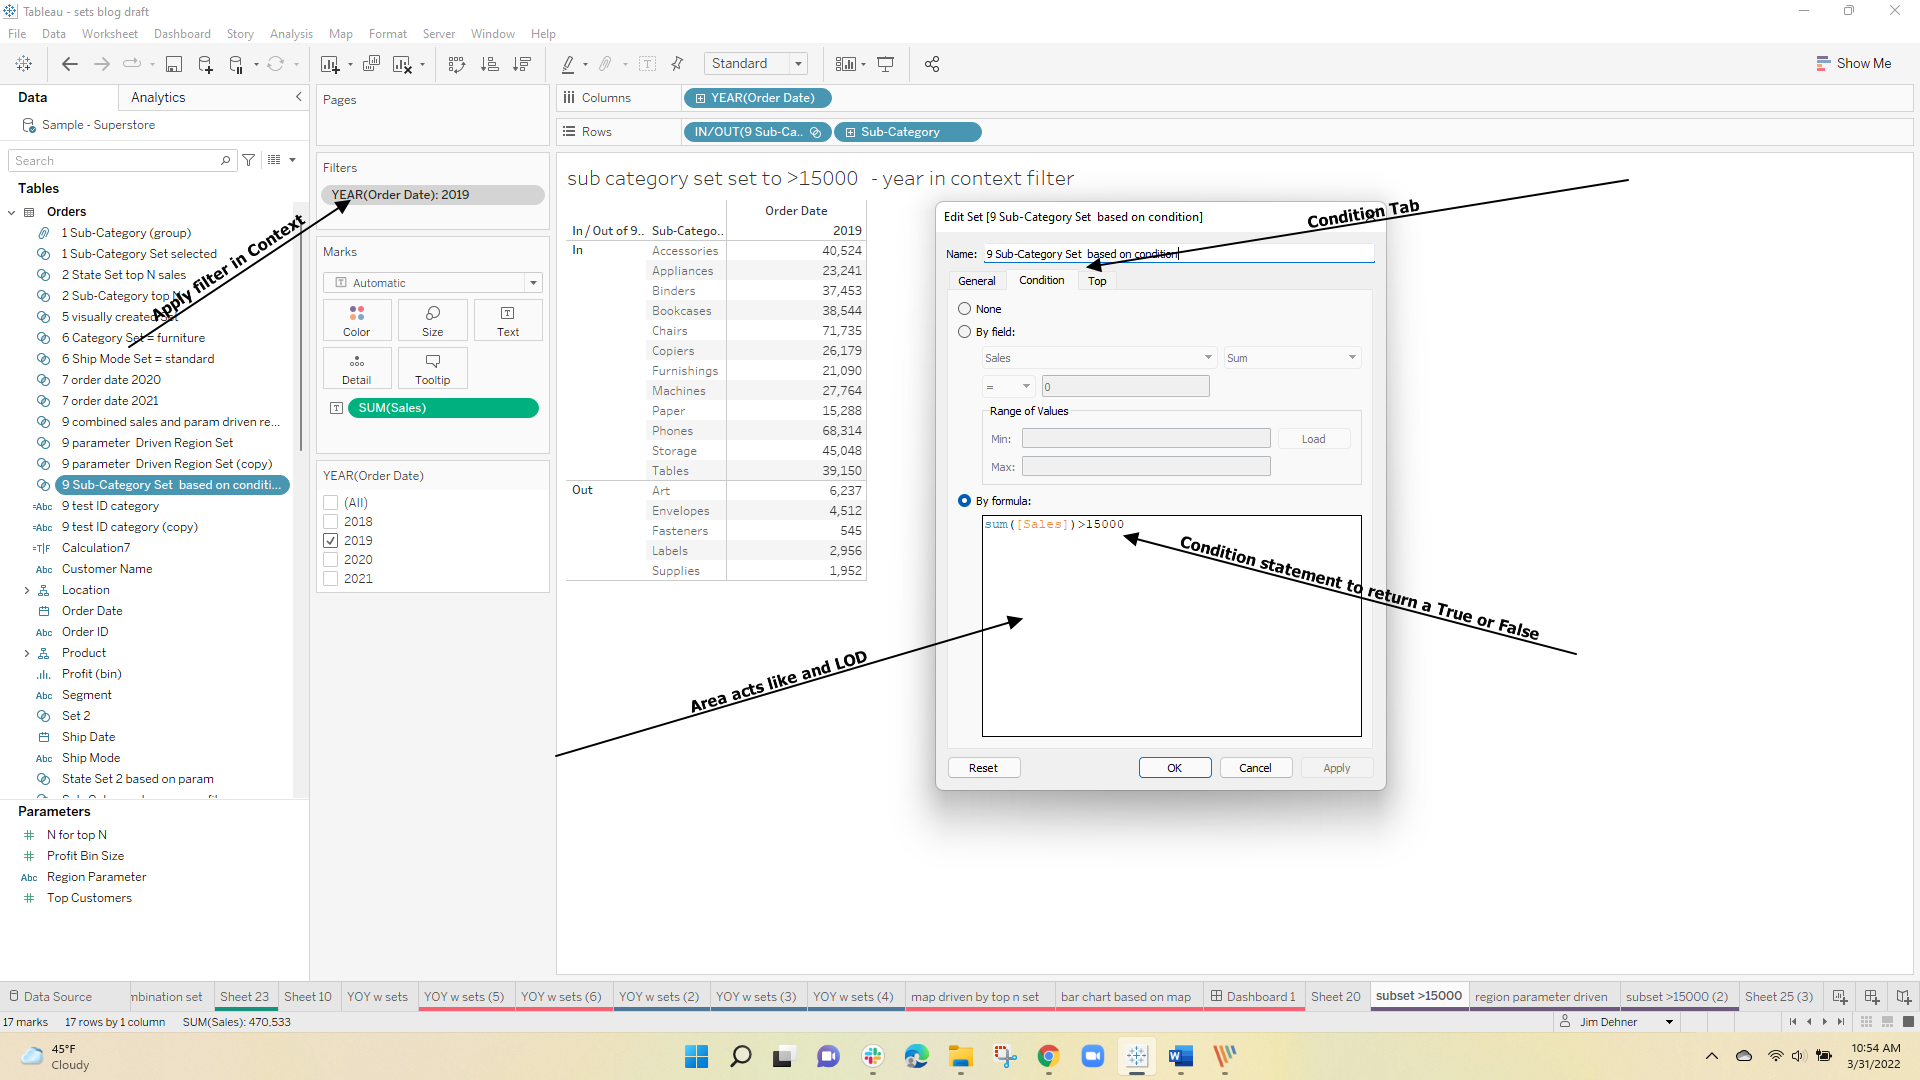
Sets can also be based on a calculation on the "Condition" tab.
This set has all the Subsets where the Sum of Sales is greater than 15,000. The condition formula frame acts as a fixed LOD so measures must be aggregated – Note that the Date filter is placed in Context to be applied before the Set is determined.
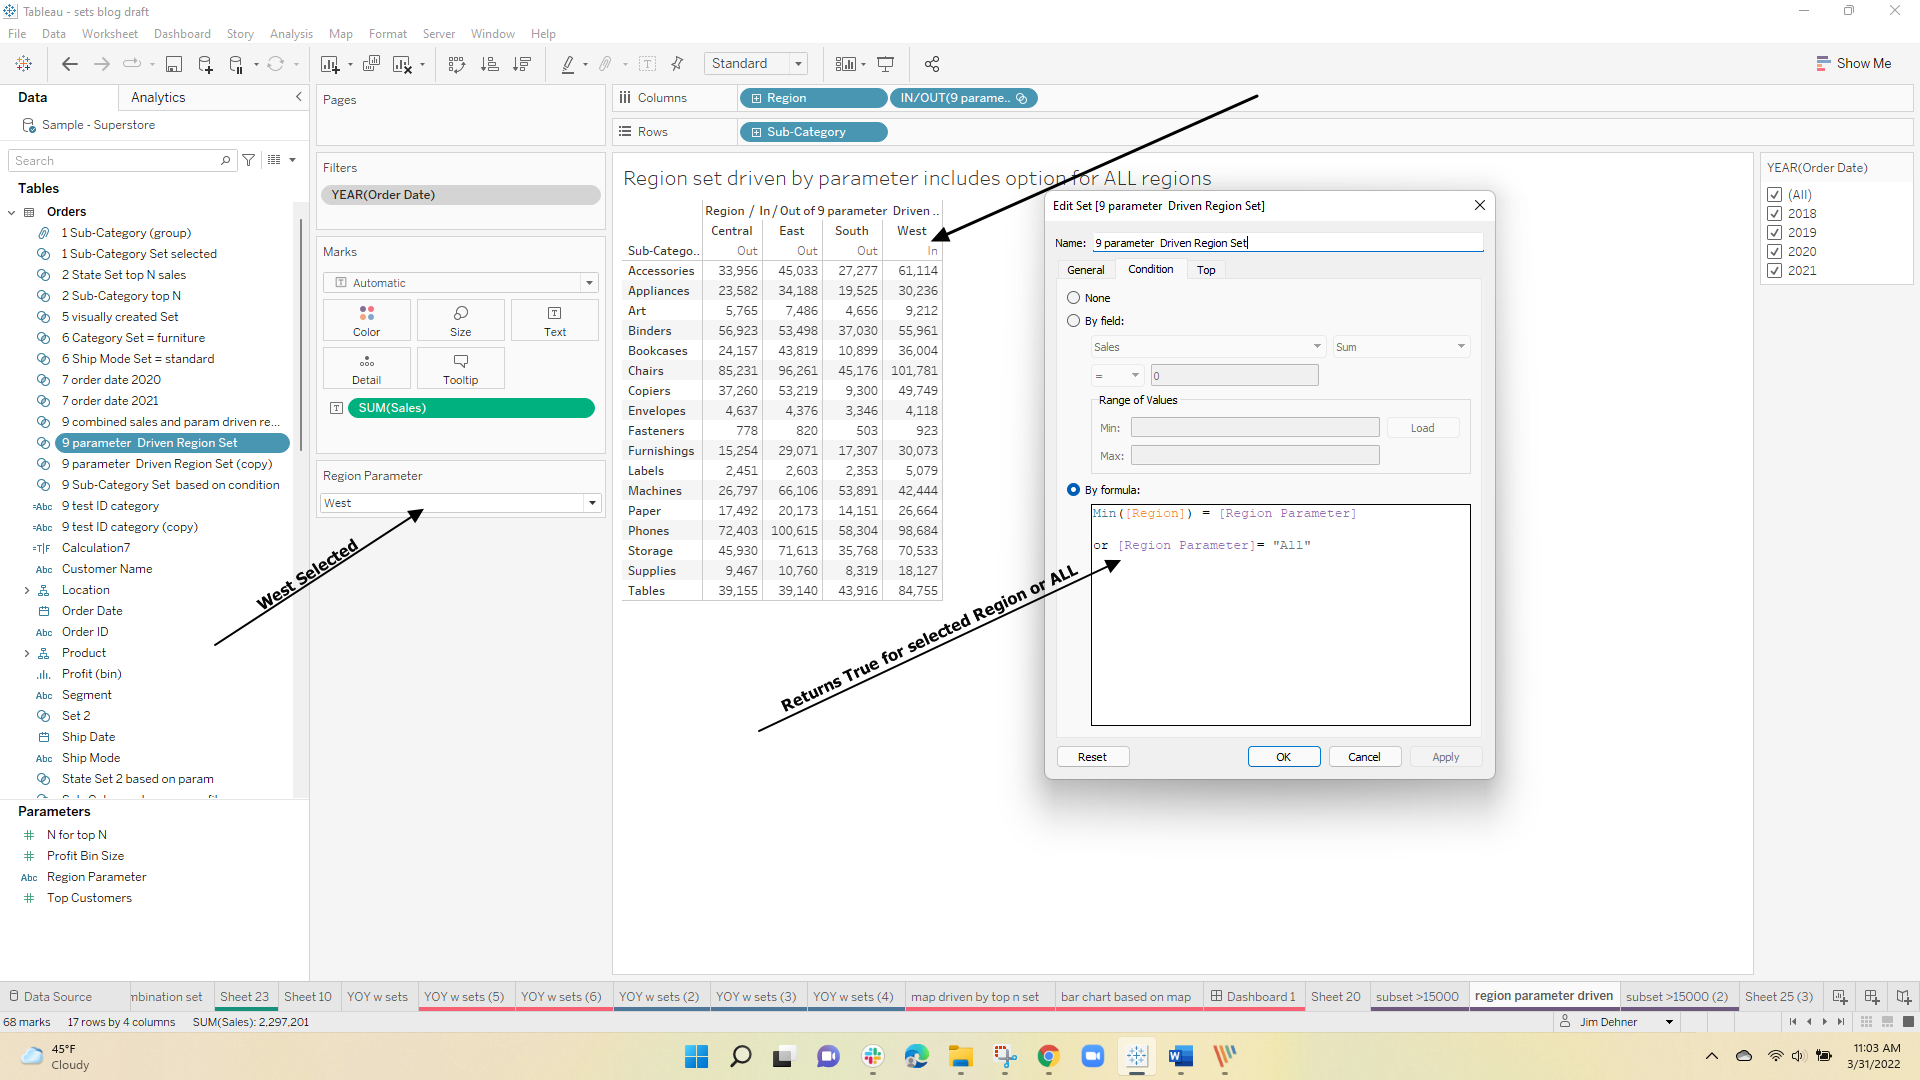
Alternatively, the condition can be parameter-driven:
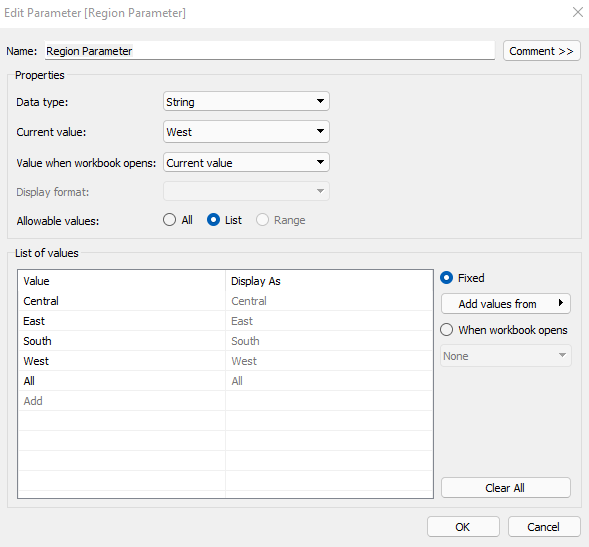
Start by creating a parameter like this on Region. Note: I included an ALL option to place all 4 regions into the In set
Then create a set on Region using a condition based on the parameter
Min([Region]) = [Region Parameter] or [Region Parameter]= "All"
The formula goes in the Condition tab as shown:
If we can create a set based on the Region and a set based on the sum of sales, can they be combined to find those subcategories with sales over 15000 and also in the selected region?
Yes, but not by combining the two in a single Condition tab. In this case, we need to place each set in the view and select the "In" group for both:
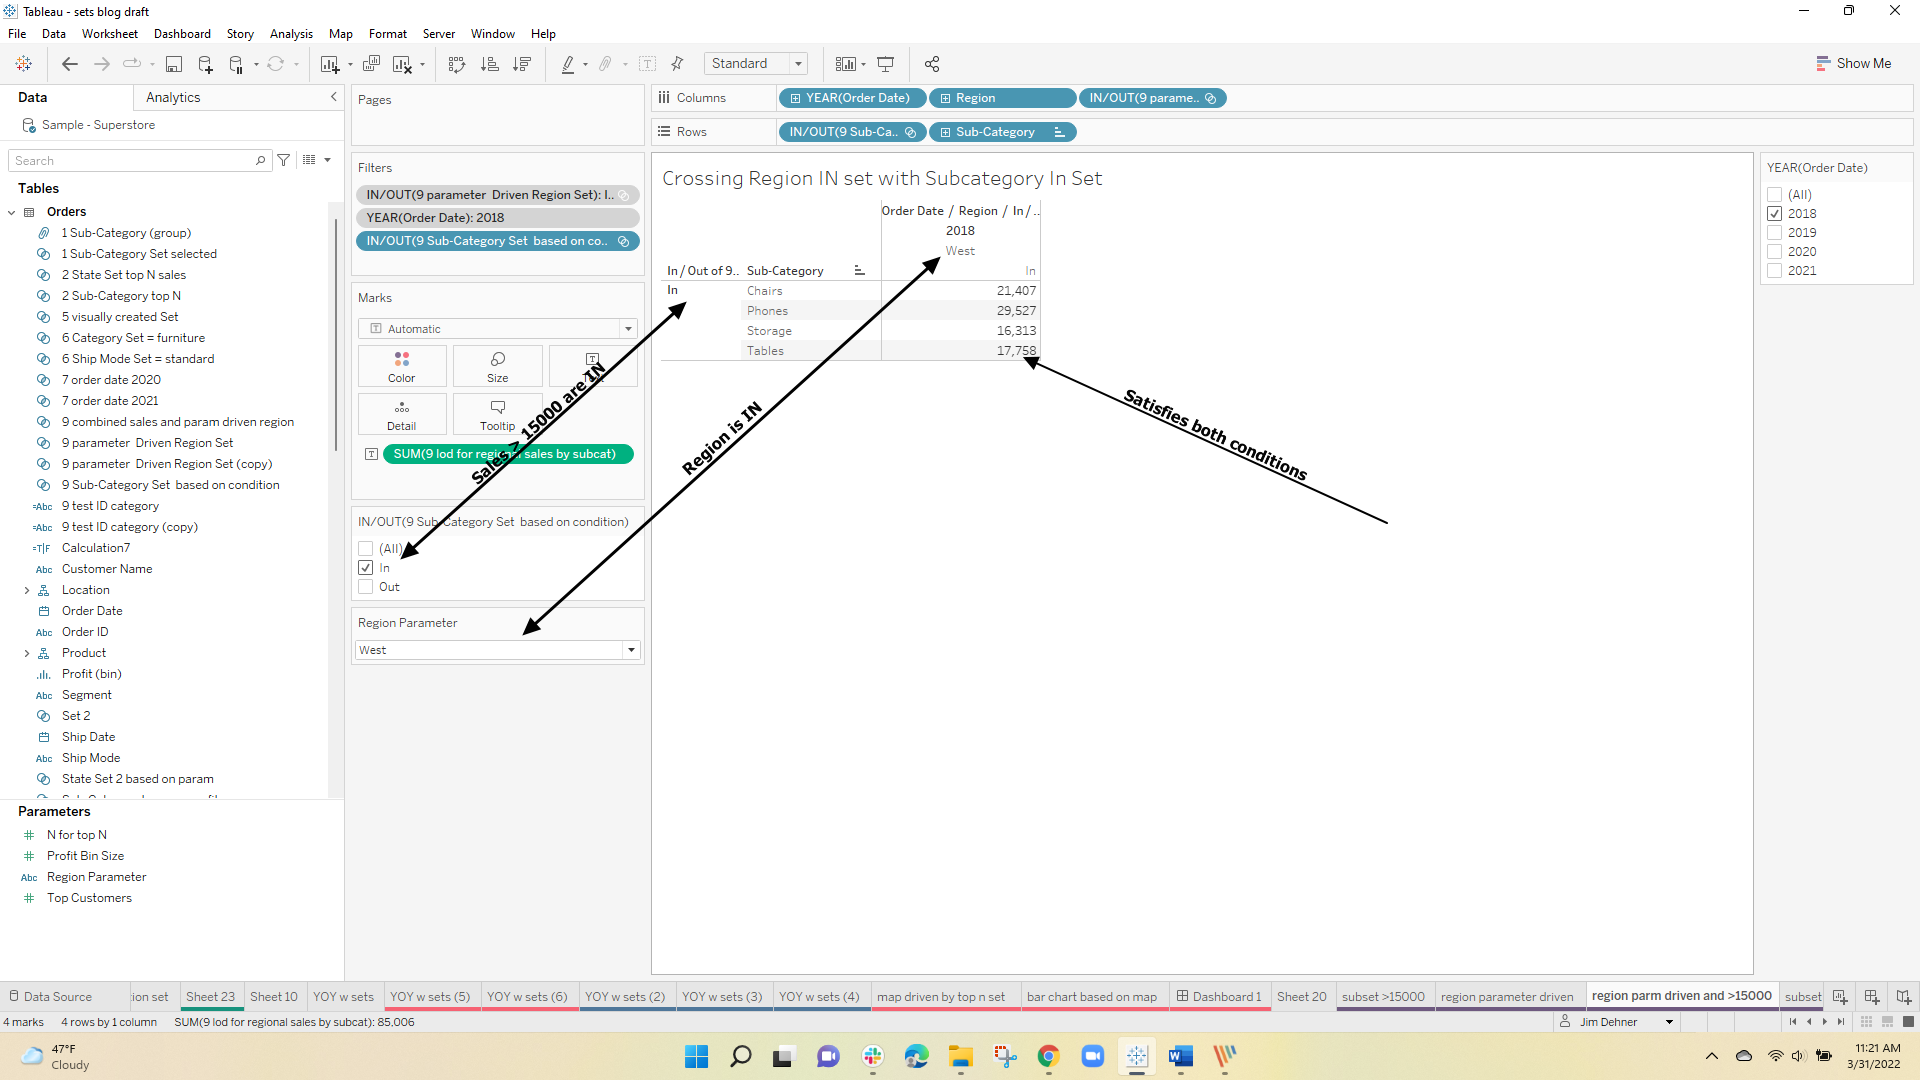
and we can also mix the In and Out groups to look at the full-year sales in each of the 4 segments

4 Set Actions
Set actions allow you to select values from the dashboard to change the "IN" set! and Yes! that is cool
It is also very easy to do:
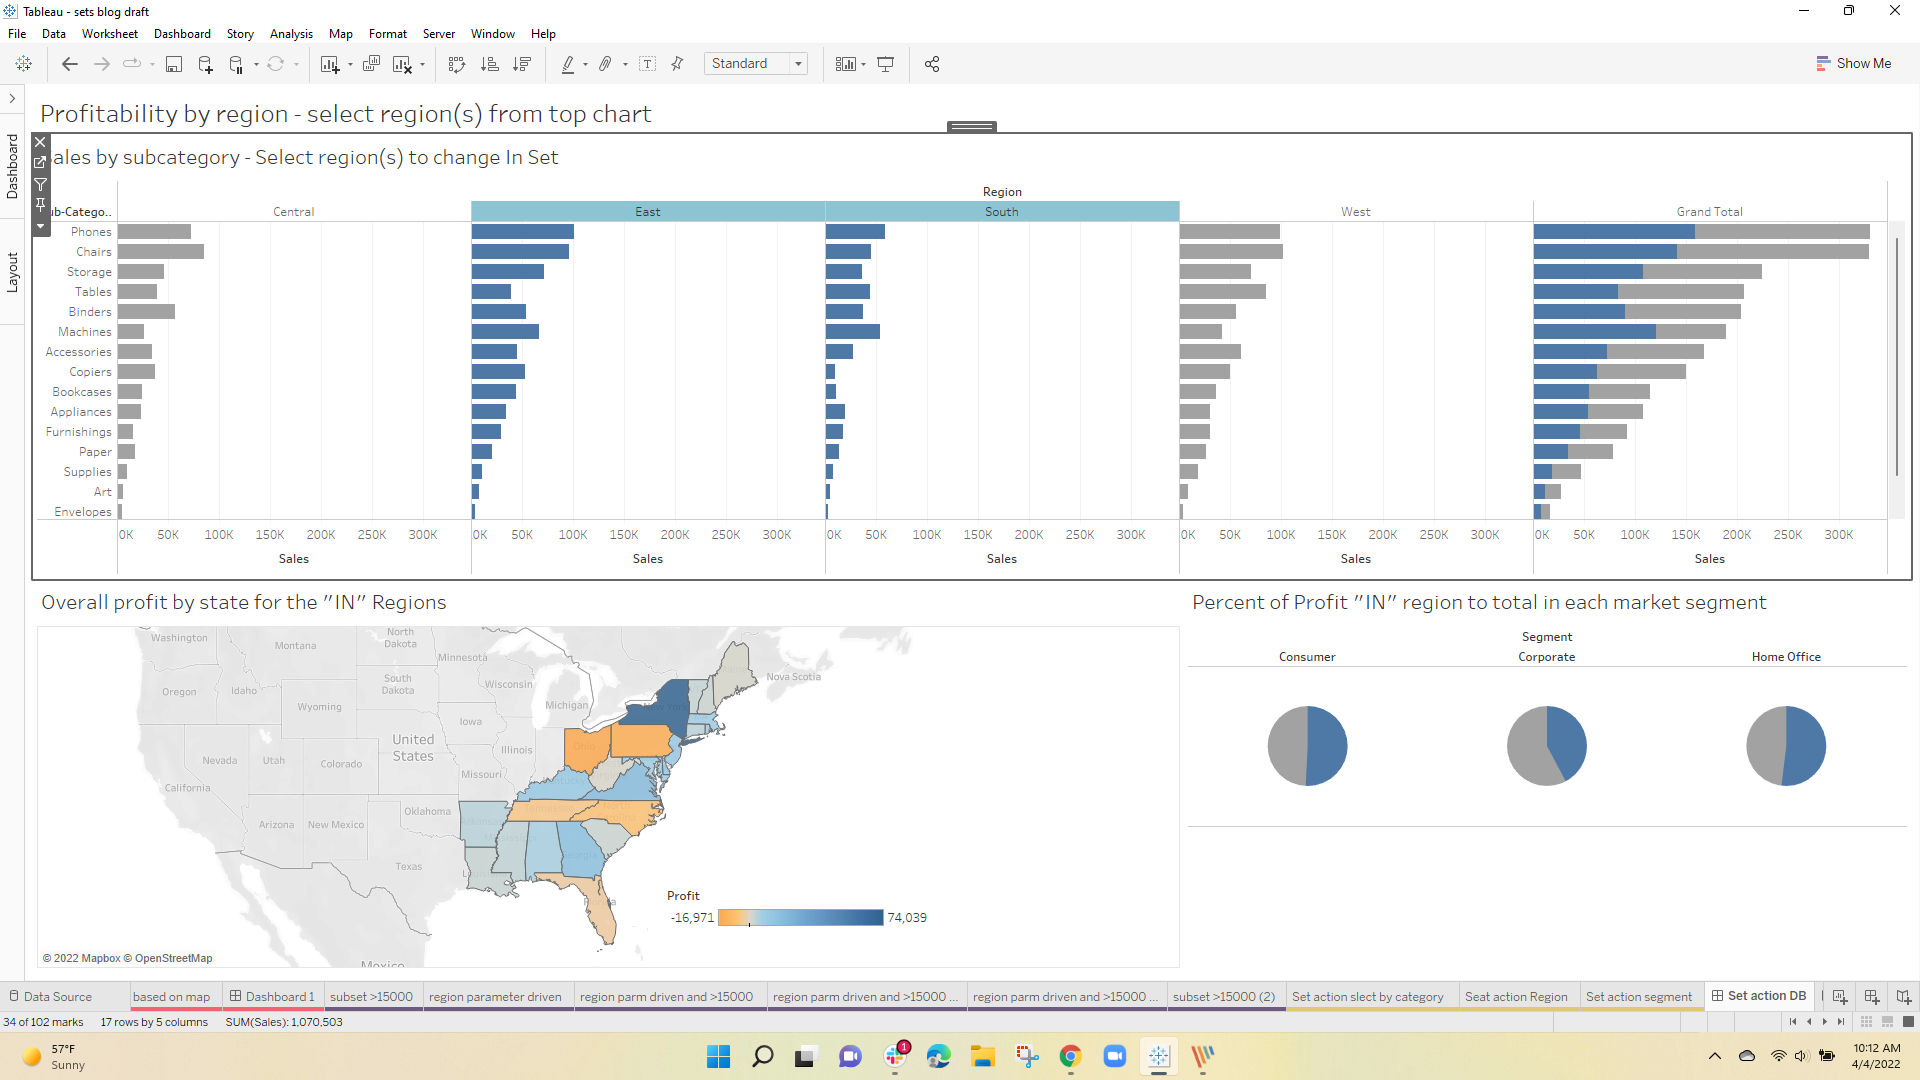
We want to use the Bar Chart by region to change a Region Set value. Then use that value to affect the proportional brushing of the total, zoom in on the profitability map, and change the market segment pie charts
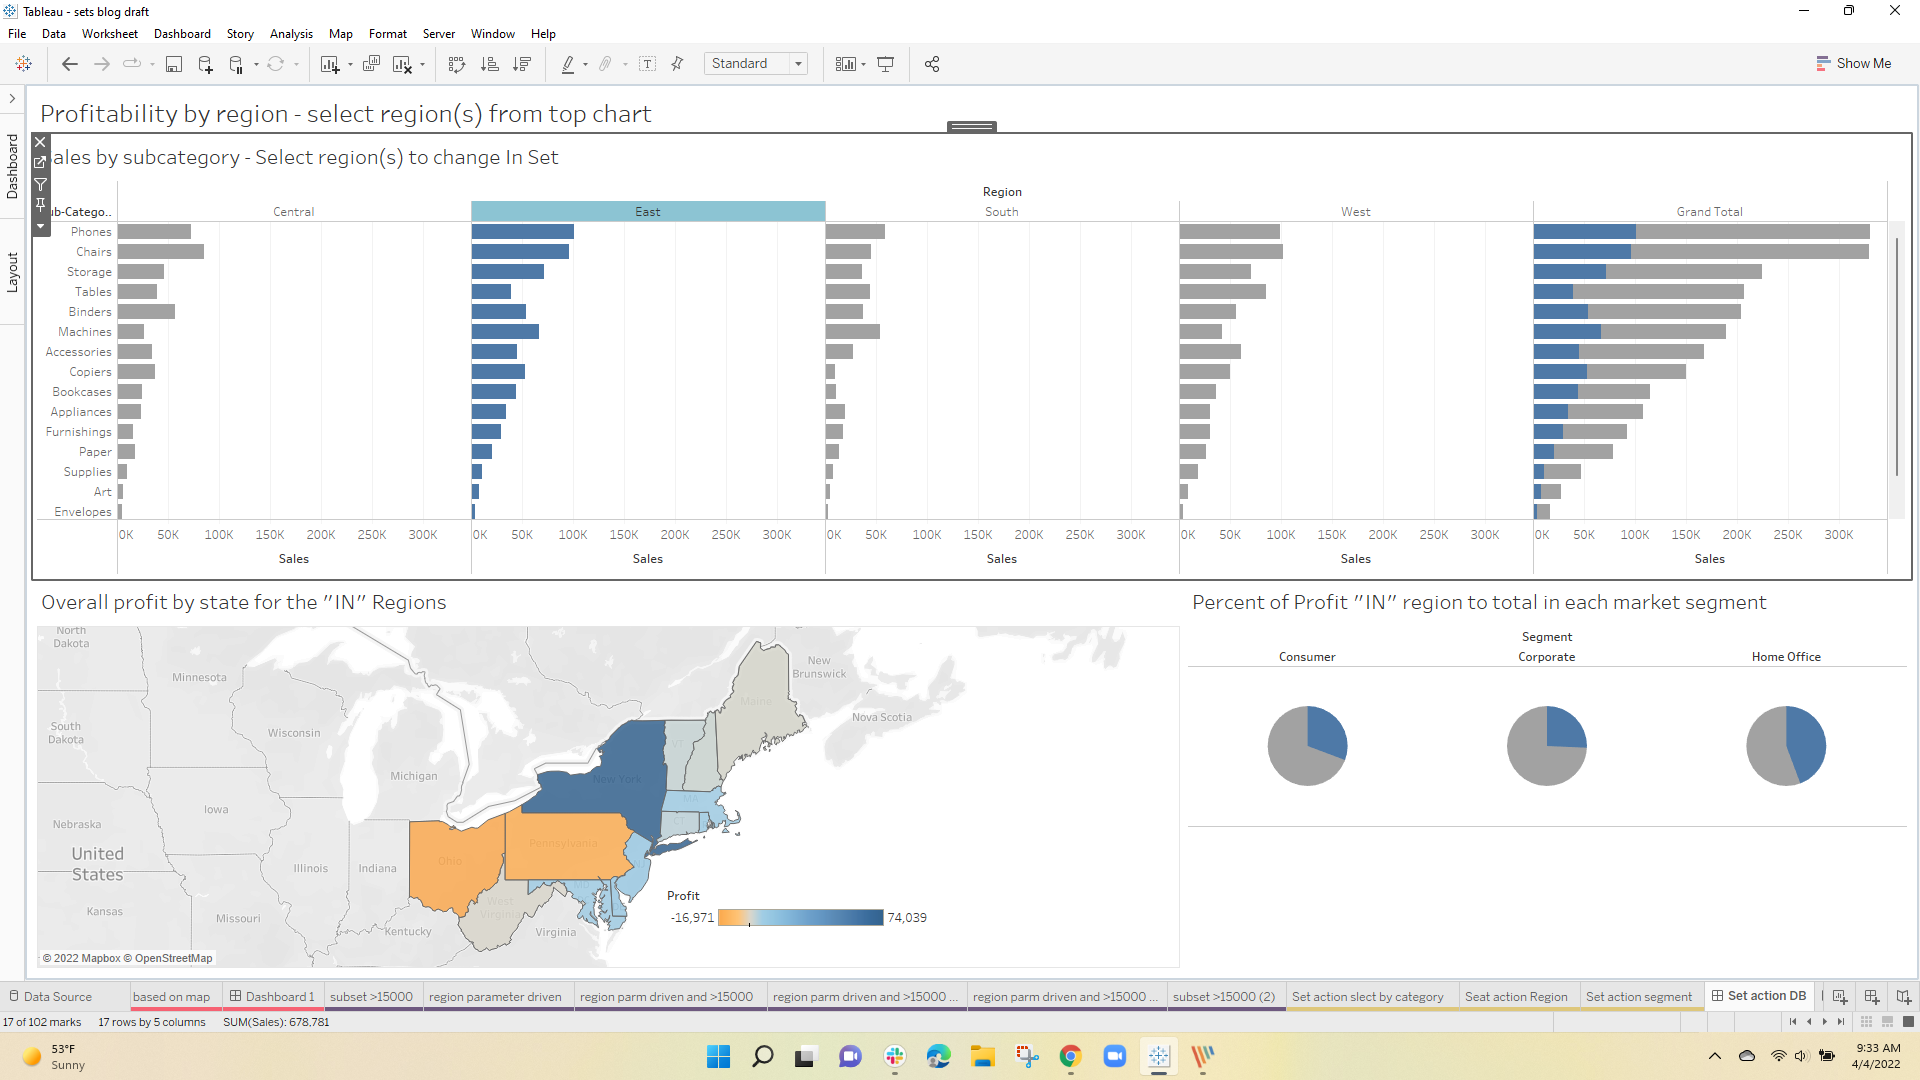
Start with creating the Region Set and the bar chart by region –
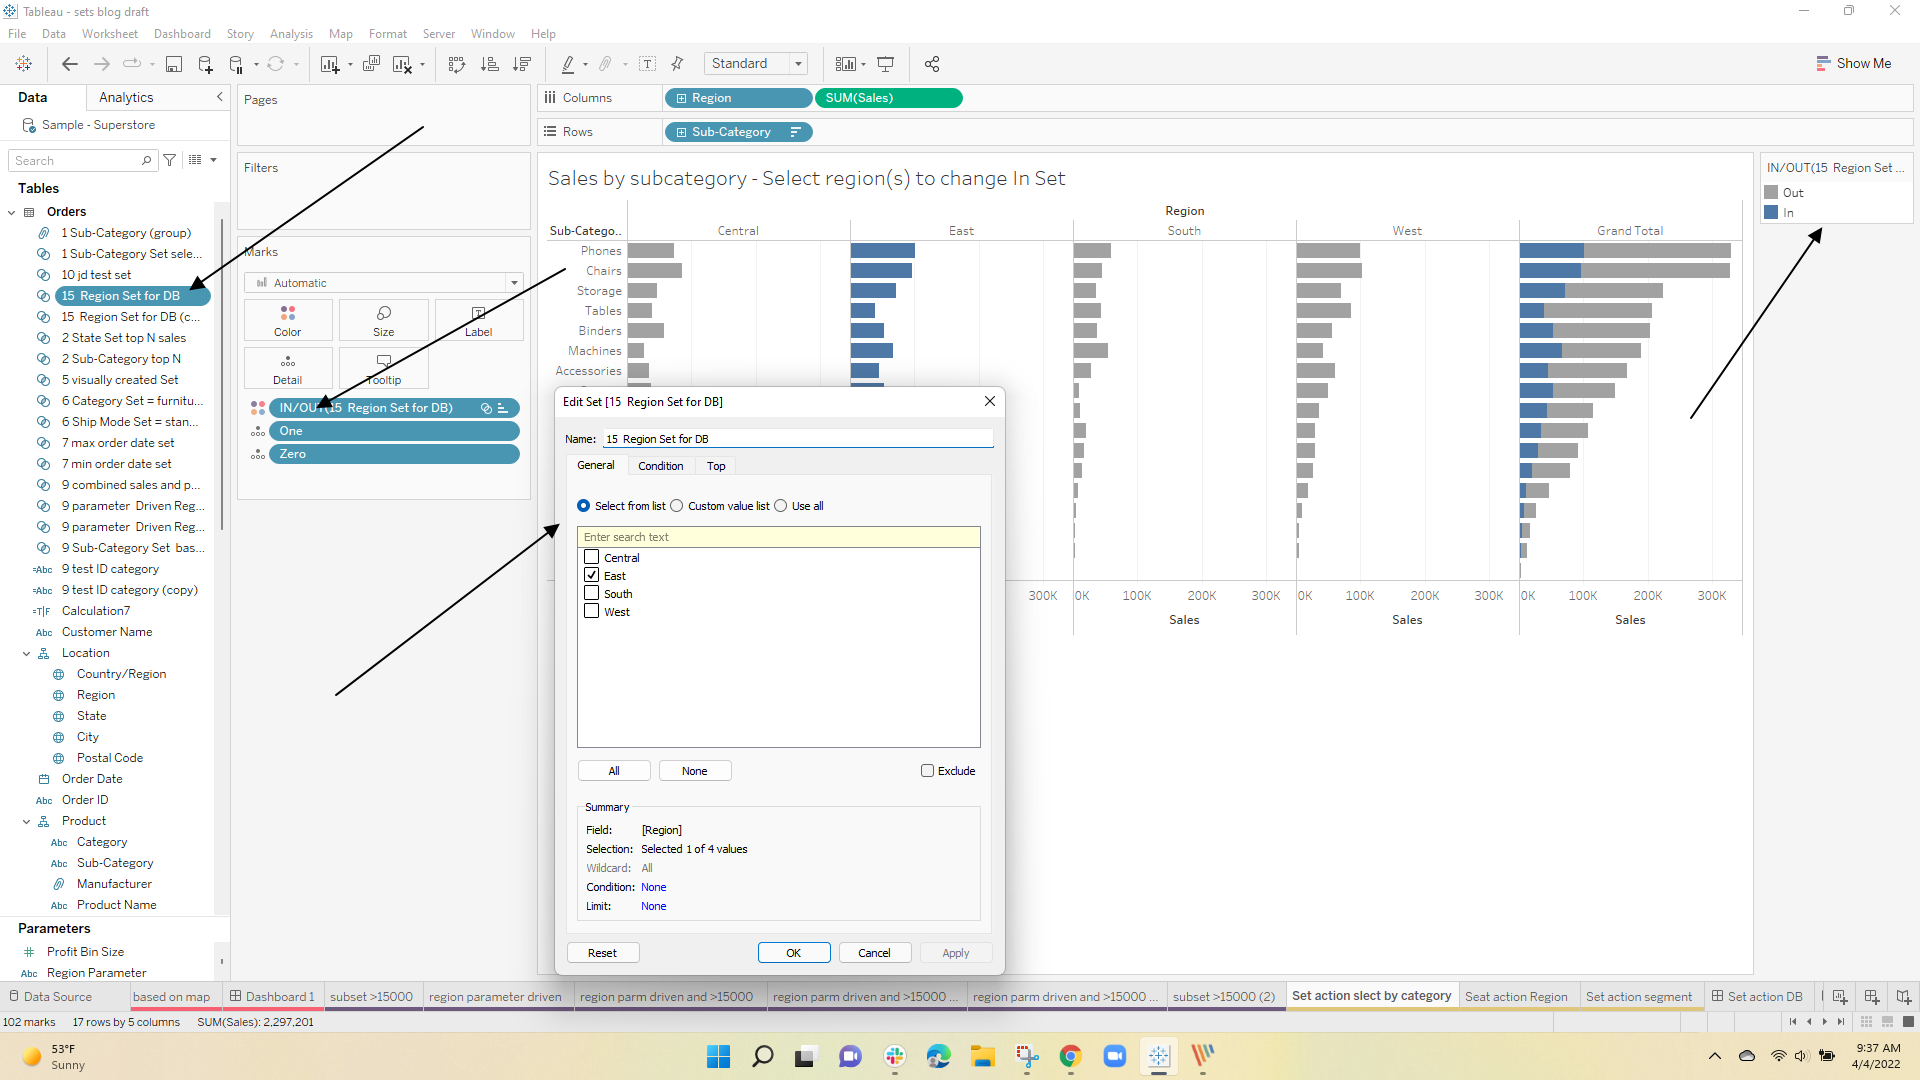
Place the set on Color to show the proportional brushing as applied on the Grand Total.
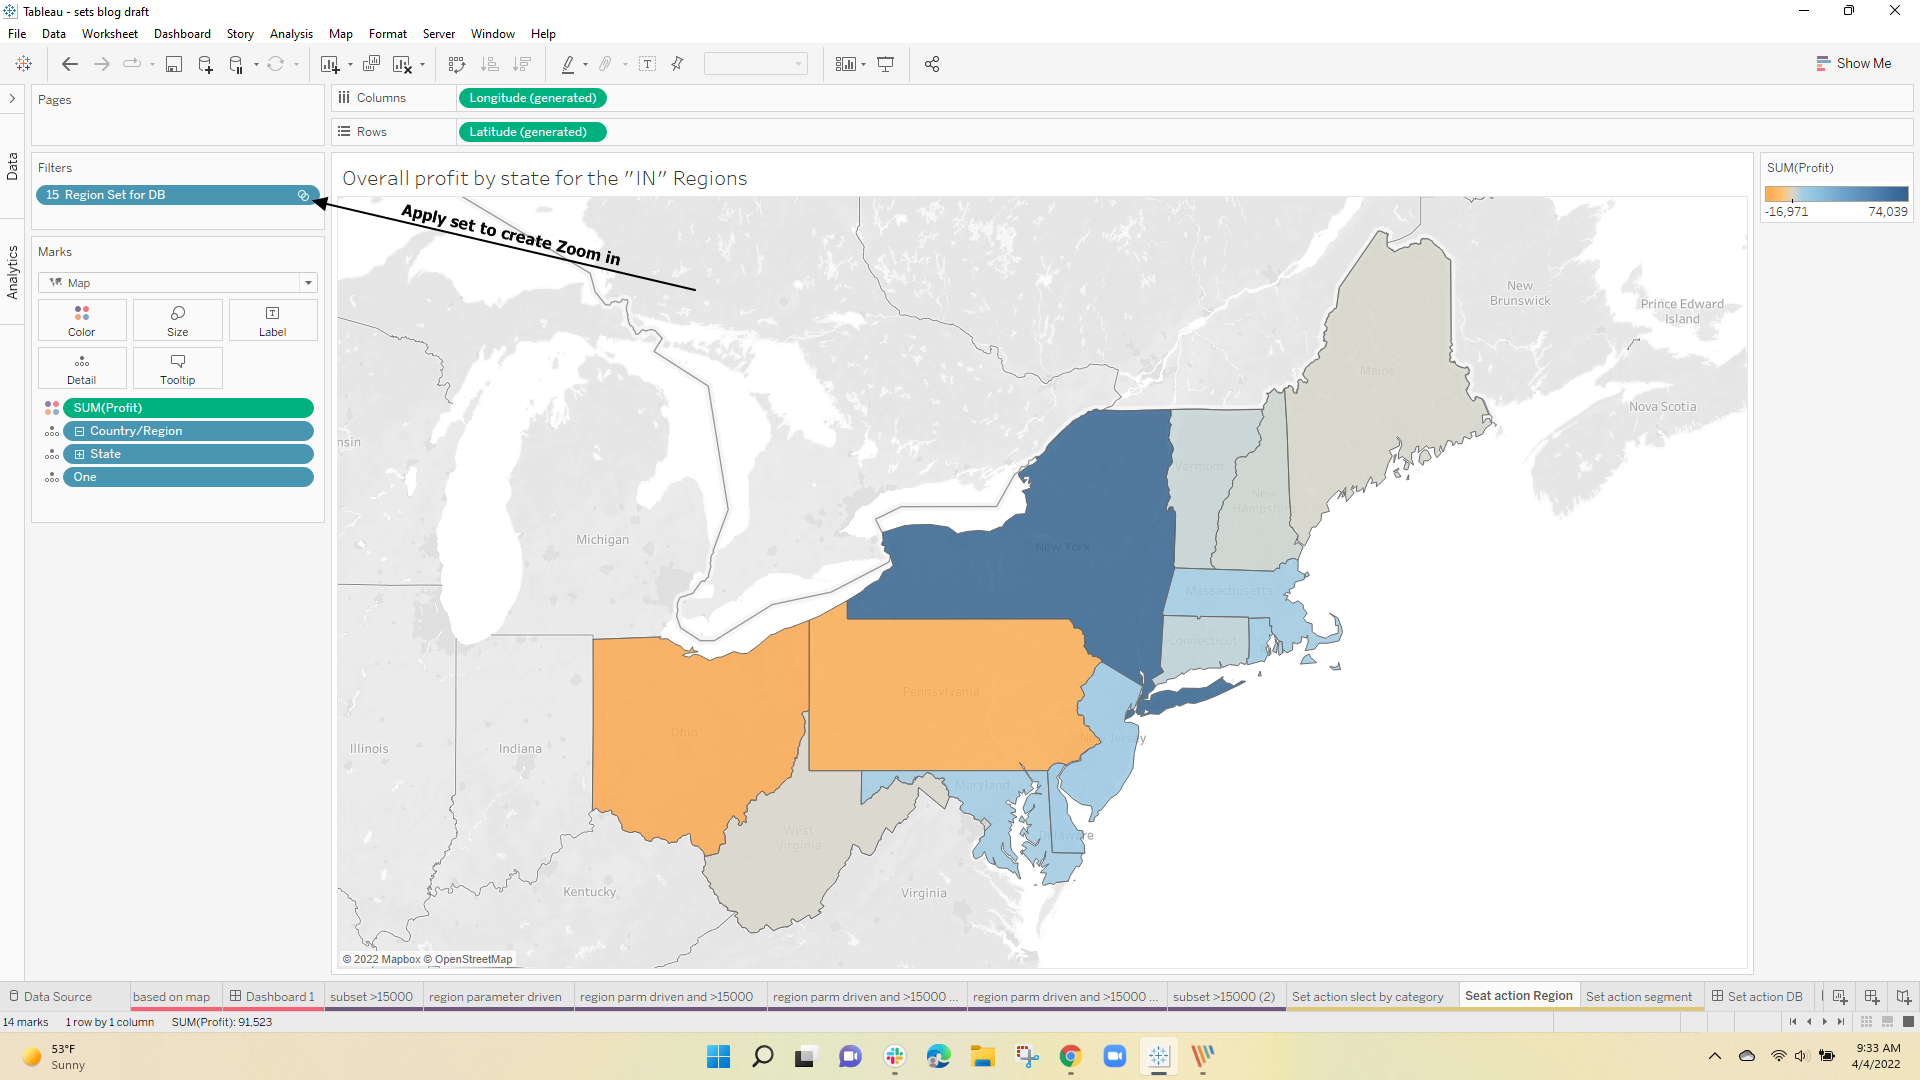
Add a map placing the set as a filter to facilitate zooming in on the selected region(s)
the last worksheet is a simple pie chart (Yes, I know pies are hard to read – but we will only have 2 segments – the In and the Out based on region.

Then just add a Set Action to the dashboard
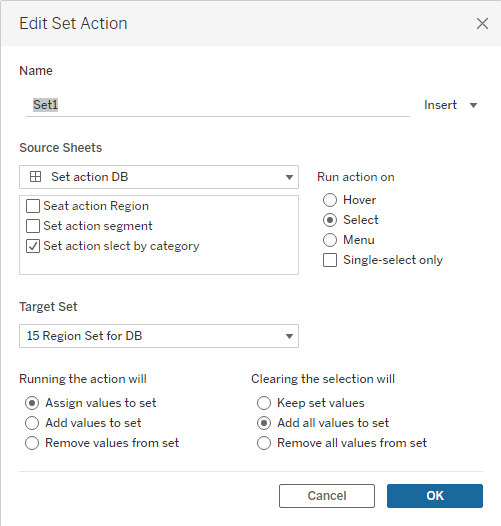
The Bar chart is the sources sheet and the Region set is selected from the dropdown in the middle – then just decide what you want to do when you select and clear the set
Hope this helped you understand sets and set actions. Now get out there and use them
The workbook used for these examples can be found at Use Case Workbook Here
Enjoy
Jim

One Response
Fantastic blog, Jim! I think sets are often overlooked, but they are powerful, indeed! I like the global properties of sets: much like parameters, they can apply to every worksheet upon which they appear. You've also awakened my curiosity for conditionally-controlled sets 🙂