
Year over Year analysis – 3 different ways
As the year comes to an end a frequent topic on the Forum is how to complete a YoY analysis – here we will look at 3 different approaches – one using table calculations, one with LOD's and a final way using sets and value pickers.
Table Calculations – Easy but has limits
The typical Forum question is how can I create a filter where the user can select a date and Tableau returns the year to date value for the current year and the previous year – Unfortunately, filters limit the data on the table that underlays the worksheet – Once data is filtered out of the table it is no longer available for use in determining the YTD or YoY values.
But the user can use a Parameter to set a date (or start and end dates) and base the YTD values on the parameter date.
Start by creating the parameter – set to select any date

next, create a calculated field to add the YTD sales from the current and prior year based on the parameter
If Datetrunc('year',([Order Date]))=Datetrunc('year',[Enter End Date ]) and
Datetrunc('day', [Order Date])<= Datetrunc('day',[Enter End Date ])
OR
Datetrunc('year',([Order Date]))=Datetrunc('year',Dateadd('year',-1,[Enter End Date ])) and
Datetrunc('day', [Order Date])<= Datetrunc('day',Dateadd('year',-1,[Enter End Date ]))
then [Sales] end
and then create a viz – set the filter to include the years of interest and use the end data parameter – and the formula returns the YTD and PYTD sales values

Now you can add 2 table calculations using the lookup() function to return the YoY $ and % values
You can add the table calculations from the drop-down or use the actual formula
The dollar difference is :
ZN(SUM([YTD YOY on Parameter and filter]))
– LOOKUP(ZN(SUM([YTD YOY on Parameter and filter])), -1)
The % difference :
(ZN(SUM([YTD YOY on Parameter and filter]))
– LOOKUP(ZN(SUM([YTD YOY on Parameter and filter])), -1)) /
ABS(LOOKUP(ZN(SUM([YTD YOY on Parameter and filter])), -1))
and when added to the table they return this

At this point most users want to eliminate the 2 blank columns for 2018 – that is one of the limitations of using table calculations – easy to use – but may not return the visual presentation you need
LOD Expressions –
An alternative is to use LOD expressions to specifically separate the current and prior year values. Once again use the parameter to specify the end date – set the LOD to the Year and the lowest level in your viz (sub-category here) and the current YTD sales are
{ FIXED Year([Order Date]),[Sub-Category]:
sum( if datetrunc('year',([Order Date]))=datetrunc('year', [Enter End Date ]) and
DATETRUNC('day', [Order Date])<= DATETRUNC('day',[Enter End Date ])
then [Sales] end)}
the Prior YTD sales are:
{ FIXED Year([Order Date]),[Sub-Category]:
sum( if datetrunc('year',([Order Date]))=
datetrunc('year', dateadd('year',-1,[Enter End Date ])) and
DATETRUNC('day', [Order Date])<=
DATETRUNC('day',dateadd('year',-1,[Enter End Date ]))
then [Sales] end)}
The YoY $ difference is simply :
(sum([TYTD Sales LOD ])-sum([LYTD Sales LOD ]))
and the percent difference is:
(sum([TYTD Sales LOD ])-sum([LYTD Sales LOD ]))/sum([LYTD Sales LOD ])
they return this

The LOD's return separate values for the current and prior years so the difference in dollars and percent is a simple calculation based on the LOD – (for a complete discussion on writing LODs see "Use LODs to create a layer in your data set")
Sets and Set Actions
Sets can be used with an End Date parameter to separate the current and past year sales
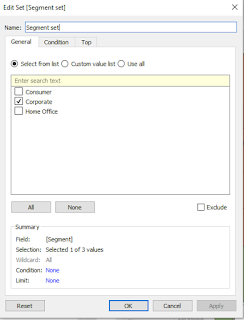
you will need 2 sets on the date in your data –

then on the Condition tab

the formula should look familiar. Current YTD is
Datetrunc('year',([Order Date]))=Datetrunc('year', [Enter End Date ]) and
Datetrunc('day', [Order Date])<= Datetrunc('day',[Enter End Date ])
and prior YTD is
Datetrunc('year',([Order Date]))=Datetrunc('year', Dateadd('year',-1,[Enter End Date ]))
and Datetrunc('day', [Order Date])<= Datetrunc('day',Dateadd('year',-1,[Enter End Date ]))
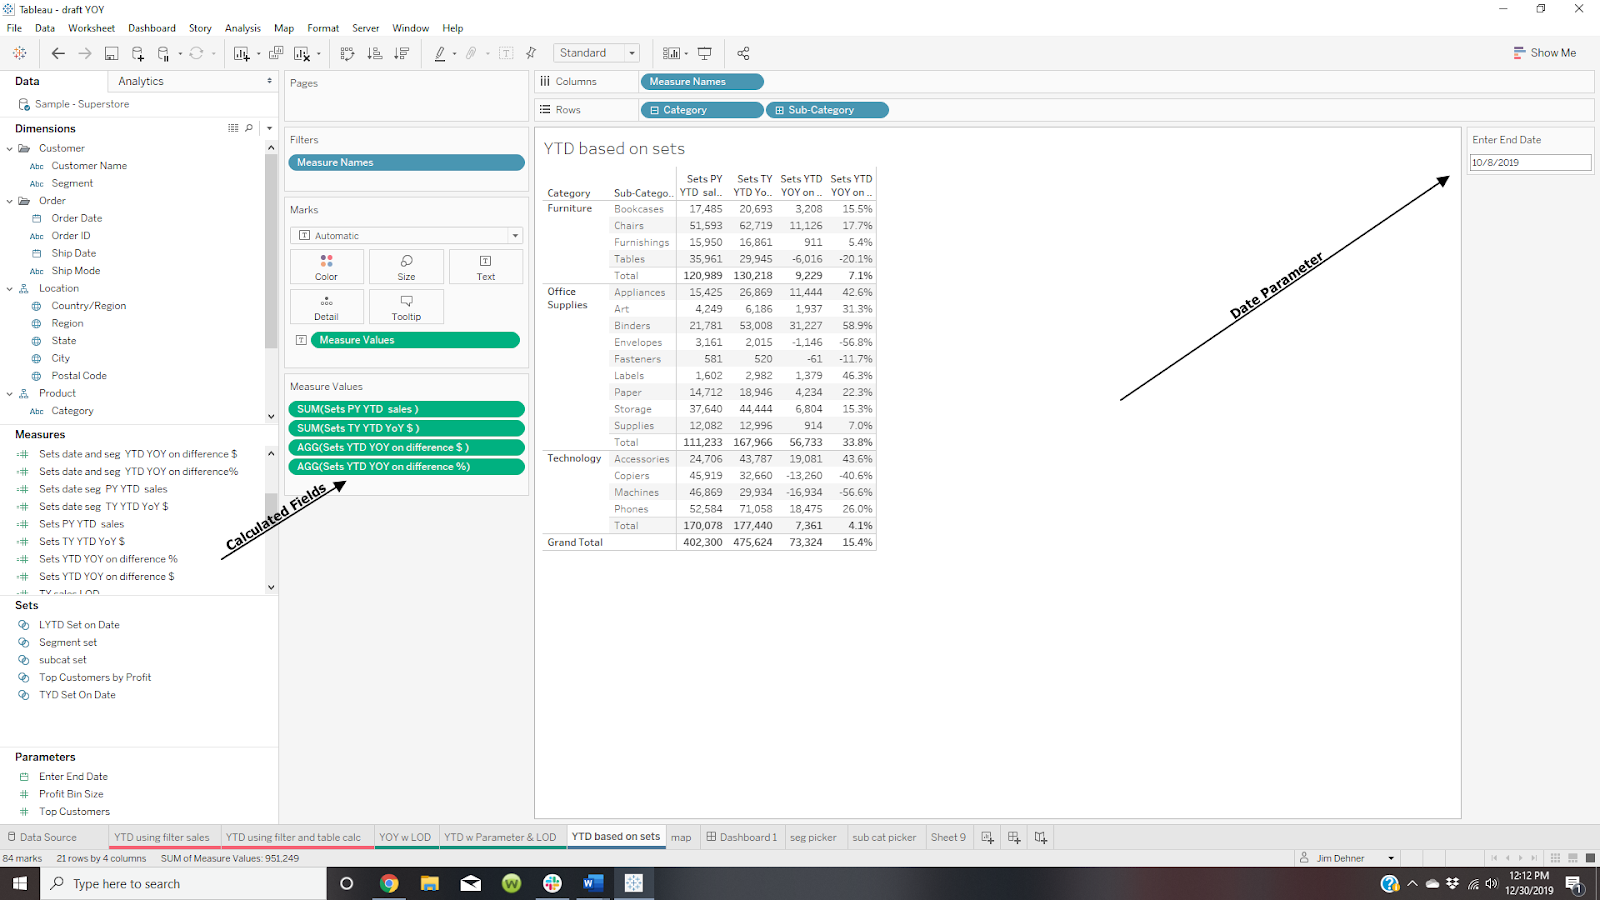
then add the formula for the current and prior year sales
(if [TYD Set On Date] then zn([Sales]) end)
(if [LYTD Set on Date] then zn([Sales]) end)
and for the dollar and percent difference
sum(zn([Sets TY YTD YoY $ ])) – sum(zn([Sets PY YTD sales ]))
(sum(zn([Sets TY YTD YoY $ ])) – sum(zn([Sets PY YTD sales ])))/
sum(zn([Sets TY YTD YoY $ ]))
and create the viz
So far we have created a text table but you can also use other chart types to look at YoY data. Here is a Map that plots YoY $ difference at the state and product segment and subcategory levels
Just add 2 more sets – one on Segment and the other on subcategory – just select any value when creating the sets (we will use set actions to change them later)

the formula for the current year sales based on the 3 sets is :
(if [TYD Set On Date] and [Segment set] and [subcat set] then zn([Sales]) end)
and the prior year sales
(if [LYTD Set on Date] and [Segment set] and [subcat set] then zn([Sales]) end)
then percent difference is :
sum(zn([Sets date seg TY YTD YoY $ ])) – sum(zn([Sets date seg PY YTD sales ]))
create a map by dragging State to the canvas


See "See it your way using sets and set actions to navigate your next dashboard" for details on Set actions and value pickers
Hope this helps as you prepare YoY statements. You can download the workbook with all of these examples from my Tableau Public site at https://public.tableau.com/profile/jim.dehner#!/vizhome/YoY3waystoload/YOYDBwSetActions?publish=yes
Jim

2 Responses
Hello, Jim Thanks for this awesome tip. I was wondering if this can be possible using parameters and customizing the calculations for quarters instead of years? So, I'd like the user to pick their comparison quarters – Say 19Q1 vs. 18Q2 and the resulting viz would be the customized QoQ change? Thanks much.
Hi
Thanks for the question – the solutions here use real calendar dates and you should be able to do a QoQ analysis – if you are using FY then see https://jimdehner2.blogspot.com/2020/10/faq-series-fiscal-date.html on this blog and if 19Q1 etc are strings first convert them to real dates – see https://jimdehner2.blogspot.com/2020/06/faq-series-convert-string-dates.html –